


How To Recognize Trend Reversals
How To Recognize Trend Reversals
When it comes to indicators I definitely have come round circle during my evolution as a trader. Like most of us I started out like a kid in the candy store, especially during the early ThinkOrSwim years, which opened the flood gates on the availability of advanced tools for lowly retail traders.
However by the time I launched Evil Speculator I already had chiseled it down to only a handful of indicators – several of them being of my own creation thanks to my coding skills.
I introduced the Zero indicator in late 2008 and it quickly became my #1 tool for interpreting participation and price action in the E-Mini futures. There is a good number of subscribers who have been actively using the Zero for a decade now, which obviously speaks to its utility.
For everything else these days the majority of the charts I look at feature two Bollinger bands and either Net-Line Levels or Spike-Highs/Lows. Still overkill if you ask me and once I grow up I plan on using no indicators at all 😉
Now the main reason that I consciously limit my use of indicators is that they, as derivatives of a price series, are inherently lagging. There are a few exceptions, for one our venerable Zero, which for the record is not a derivative of the E-Mini but uses a trail mix of equity related market measures.
Reading The Tealeaves
Many traders use stacks of indicators in order to gauge the strength of a trend and to pin a possible reversal. However no indicator or combination of indicators will ever enable us to call a top or a bottom – simply because indicators are derivatives of price and thus are inherently lagging. Period.
Of course we try to get close as possible or better yet just resign ourselves to the fact that price action cannot be predicted and that we as traders remain relegated to eternally ride the coat tails of the market.
For me and most of my peers it’s not so much an exercise of pinning tops or bottoms but to know what type of market phase I am participating in. I’m totally fine with missing out on top or bottom ticks – I just want to know which beast I’m dealing with: Bull, Bear, or Sideways.

To get a good read these days I confine myself with looking at the price action and in particular at price highs and price lows, which admittedly are well expressed by Spike-Highs/Lows – yes, an indicator (sort of).
The E-Mini chart above shows a series of Net-Lines which are similar in nature but not identical to SHs or SLs. Which is why I have pointed out major SHs via green and major SLs via orange arrows. Pay close attention to the series of alternating SHs/SLs that accompanied the recent low volatility rally in equities.
Which up to this moment remains intact as each new SL sits on top of the last one. The day that changes we are looking at a possible correction lower.
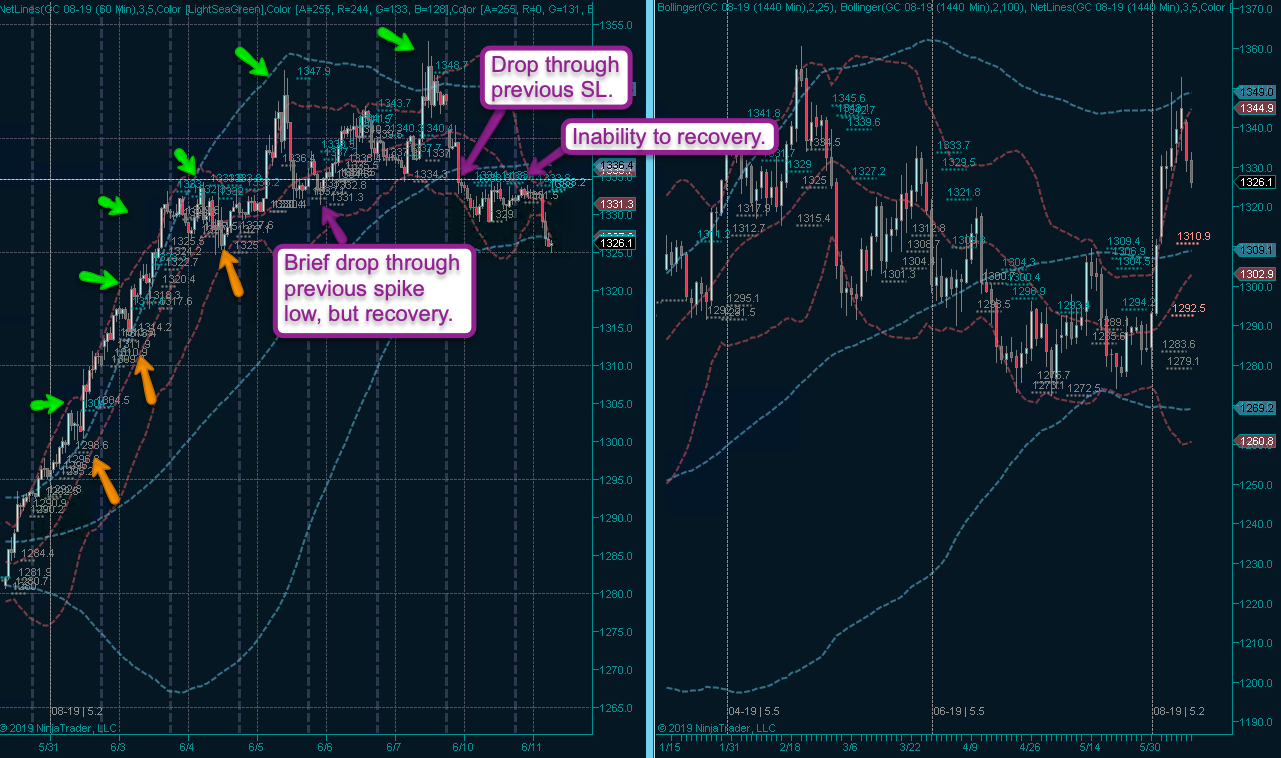
For a great example of just that let’s take a peek at the gold futures over the past few weeks. The rally higher there was so vehement that we were having difficulty pointing at SHs and SLs as the reversals were extremely shallow.
The very moment that started to change and volatility kicked in it spelled the looming end of the ongoing advance. But it wasn’t until a veritable breach of the rising SL series (which I pointed out on the chart) and a failure in recovery that selling pressure really made itself felt.
There is still a chance of a reversal higher, but if we are able to count a series of lower SHs and lower SLs then it will become clear that bears are in possession of the ball with the odds of further downside.
Beauty In Simplicity
As you may have realized I am not using any machine learning tools or complex algorithms here. It’s a simple exercise in reading the price action, that’s all. Which by the way is only one example of many ways how being able to properly interpret price action trumps any indicator every time.
BTW, this is a topic I have spent considerable time covering in my Price Action Master Class I’m about to release by early summer. Definitely a series to look forward to if you are a discretionary or systemic trader.


