


Realized Versus Implied Volatility
Realized Versus Implied Volatility
People talk about volatility all the time and often talk about completely different things. So I’m going to walk you through the basics. First of all we need to differentiate between realized volatility (or often referred to as historical volatility) and implied volatility.
Realized Volatility
Let’s start with realized volatility it’s more intuitive to most people. It represents to the magnitude of the actual price movement in a particular financial instrument over a defined period. So what RV expresses is the range of the price swings in that period.
Let me give you an example. If the S&P goes from 2,800 to 2,900 in a week then that represents an advance of 100 handles or 3.6%. And if it then goes from 2900 to 2950 the week after, then that represents an advance of 50 handles or 1.7%.
Okay, so far so good. Now if the S&P goes from 2950 to 2975 the following week then that’s another advance of 25 handles or 0.8%. Finally the week after we have yet another advance of 5 handles from 2975 to 2985 or 0.3%.
Signed Returns
By the way, mathematicians, financial analysts, or quant traders don’t ever talk about drops or advances, they simply refer to them as signed returns. And signed of course means that the number can be either positive or negative. Keep that in mind for later.
By calculating the percentages we basically create what is called ‘normalized returns’ or ‘log returns’. That allows us to measure all variables in a comparable metric. Alright, now let’s look at the series of log returns: we have 3.6, 1.7, 0.8, and 0.3.
You may have noticed that the returns are getting smaller, and although the S&P has gone from 2800 to 2975 in four weeks, it’s doing it in ever-smaller intervals. If we calculate the difference between each consecutive log return (the percentages) then we get to -1.9, -0.9, and -0.5.
This is only one among many ways of measuring realized volatility, but in any case it clearly is dropping. So this exercise may give you an idea why we bother to look at realized volatility in the first place.
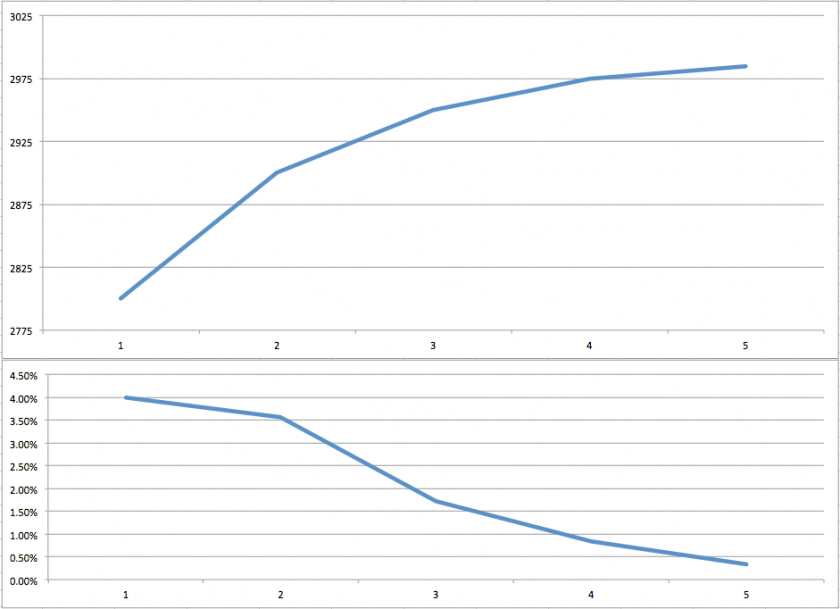
If we plot this series as a graph as shown above then we quickly grasp that the vehemence of the rally is diminishing and that perhaps a correction lies ahead.
Implied Volatility
In contrast to historical volatility, implied volatility aims to look ahead. It is often interpreted as the market’s expectation for future volatility of a stock and is implied by the price of that stock’s options. Here “implied volatility” means it is not observable in the market but can be derived from the price of an option.
In simple terms, implied volatility or IV is determined by the current price of option contracts on a particular stock or future. It is represented as a percentage that indicates the annualized expected one standard deviation range for the stock based on the option prices. And for that reason that number is unsigned, meaning it’s always a positive number.
For example, an IV of 25% on a $200 stock would represent a one standard deviation range of $50 over the next year. Did I just blow your mind? Suddenly all those magic numbers on your option chain start making sense! 😉
Standard Deviation
Okay, so what does ‘standard deviation’ mean? We covered this on several occasions here but let’s do it one more time for the noobs. In statistics, one standard deviation is a measurement that encompasses approximately 68.2% of outcomes.
When it comes to IV, one standard deviation means that there is approximately a 68% probability of a stock settling within the expected range as determined by that stock’s option prices. In the example of our $200 stock with an IV of 25%, it would mean that there is an implied 68% probability that the stock is between $150 and $250 over the coming year.
By the way, volatility doesn’t increase linearly with time, so the monthly number is not 1/12 of the annual estimate but rather ~1/3.5 the monthly number. So again for the example above. if the annualized IV of our stock was 25% then you can expect roughly a 30-day IV of ~7.1%.
And why does any of that matter?
Because options essentially came into existence as insurance contracts, and when the future of an asset becomes more uncertain, there is more demand for insurance on that asset. When applied to stocks, this means that a stock’s options will become more expensive as market participants become more uncertain about that stock’s performance in the future.
When the uncertainty related to a stock increases and the option prices are getting more expensive, IV will increase. This is sometimes referred to as an “IV expansion.” On the opposite side of IV expansion is “IV contraction.” This occurs when the fear and uncertainty related to a stock diminishes. As this happens, the stock’s options decrease in price, which results in a decrease in IV.
In summary, IV is a standardized way to measure the risk premium (vega) charged on the options of a stock.


