


How To Pick Great Entries Like A Pro
How To Pick Great Entries Like A Pro
The tape has been boring AF over the past few days which is an excellent time to teach you guys a thing or two about price action. And let me start out by ripping off the band-aid and telling you straight forward that relying solely on indicators – ANY indicator – is HUGE mistake. One that may in fact cost you your trading account.
That is – unless you know how to read raw price action.
Yup, that’s right – Mike is back again with his bloody Zen riddles.
But hang on, as you shall see there is method to my madness, plus I have this annoying habit of backing up my big mouth with evidence and heaps of data.
Anyway, the main thing to consider when looking at a chart is whether it’s in a trend or if it’s in a range.
Let’s take the current BTC/USD chart for example:
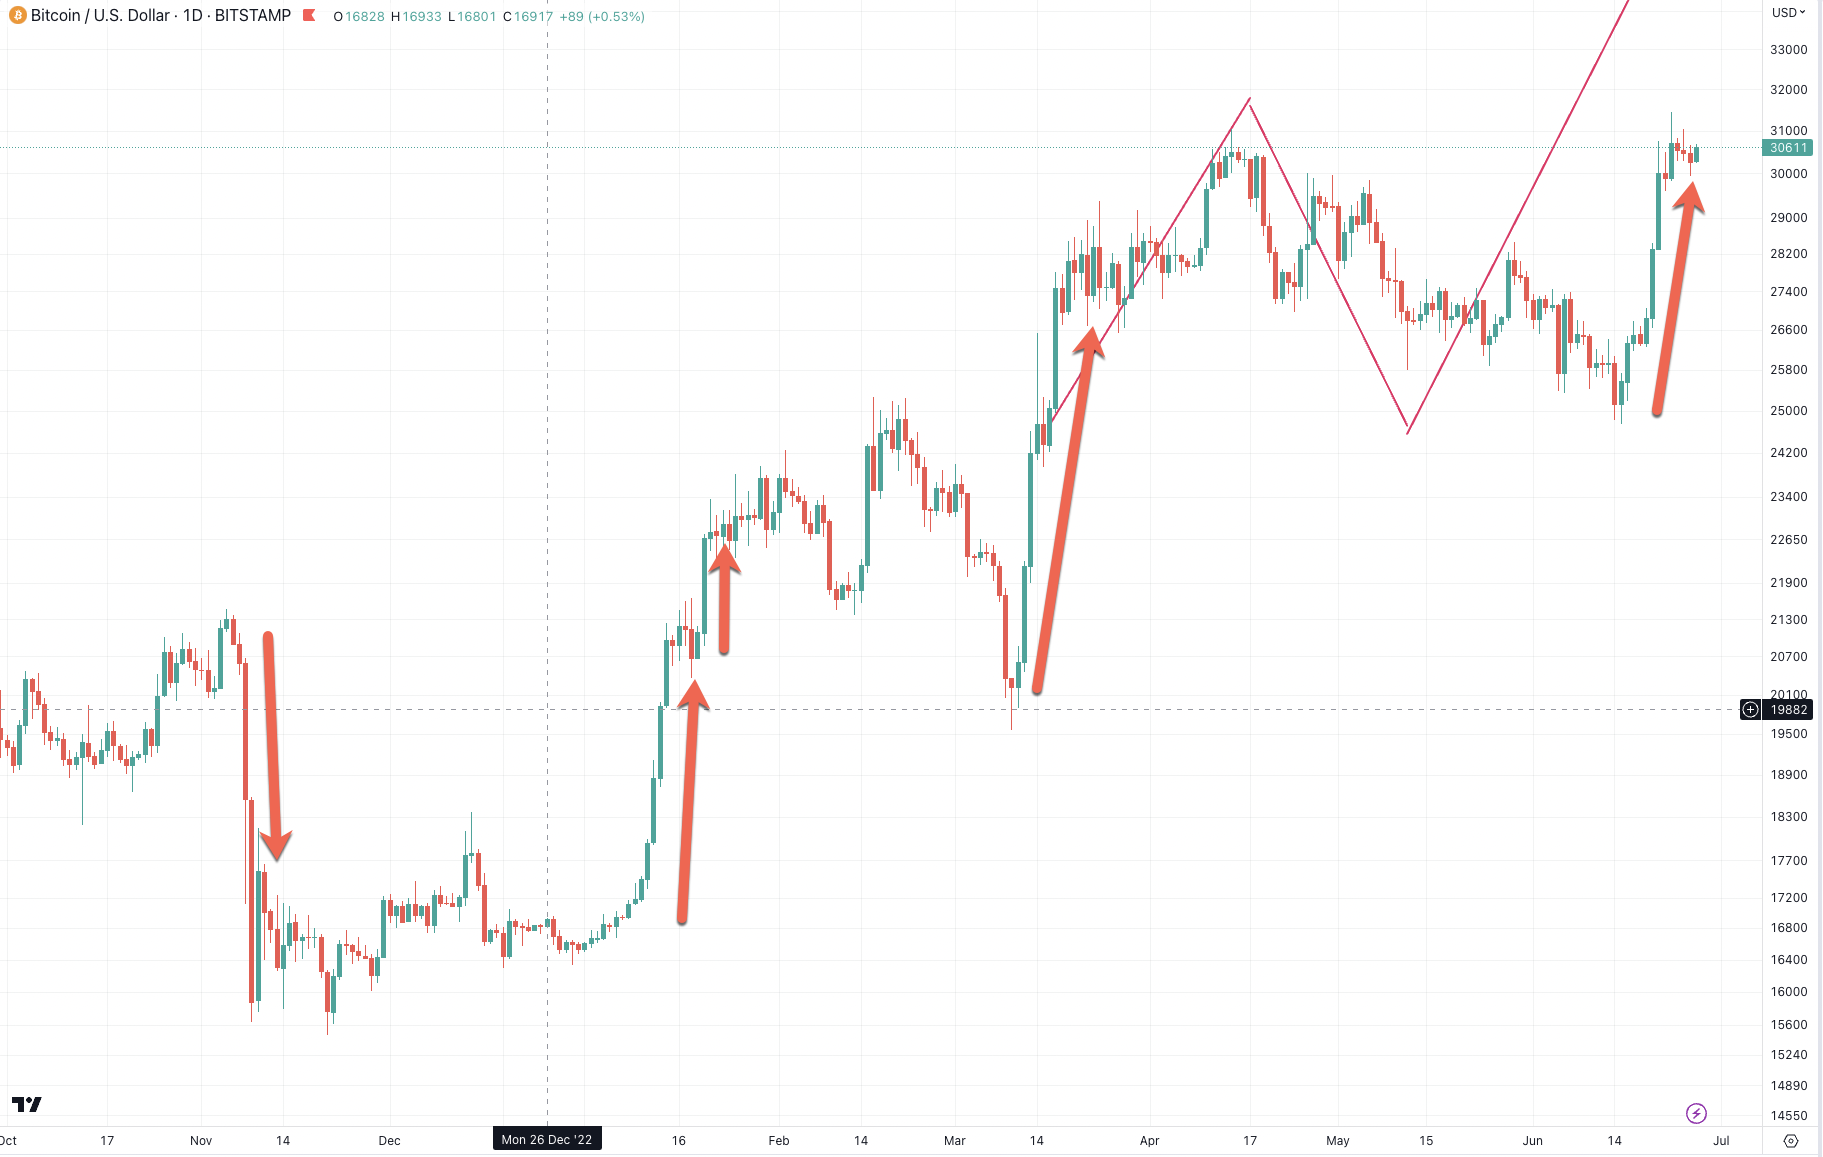
Let’s say you want to trade this type of price movements. A few basic questions may come to mind:
Where do you buy and where do you sell?
What time frame do you actually trade on?
When do you know it’s time to take profits?
When is it time to cut and run?
Questions, questions – who would have known this whole trading thing would get so complicated, right?
Now let’s assume that you’re not a complete moron (I hope) and aren’t shooting from the hip, meaning you are NOT trading based on social media posts, Reddit tips, or your personal opinions about what the market may do next.
Because if that was the case you’d be in the wrong place. We’re serious players here and serious players have a plan.
Meaning we aspire to produce an edge by pairing a particular type of price action with trading rules that produce a positive outcome, a.k.a. profits.
If that’s an alien concept to you then here’s a 3 min crash course that’ll put you on right track.
C.R.E.A.M Dolla’ Dolla’ bill, ya’ll.
But as it turns out inexperienced traders often attempt to trade on rules that are supposed to work in ANY market environment.
And I really hate to break it to you (okay, not really) but that approach isn’t just foolish but almost certainly doomed to fail.
And why is that? Because market behavior across every single market (stocks, forex, futures, crypto) always oscillates between a set of discrete phases or market cycles.
Up versus down: That’s easy. Traditionally markets mostly move to the upside, which means they are negatively skewed. Negative skew means it has a bullish bias. Look at a LT bitcoin chart and you see what I mean.
Market movement over time: Take stocks for example: On average 87% of market advances or markets declines (so we don’t care about direction) occur in about 11% of the time.
And it’s even more extreme on the crypto side of things.
Take a second look at the chart I posted above and you quickly realize that those ratios narrow to about 95% and 5%.
Meaning in crypto 95% of market advances or markets declines occur in only about 5% of the time on average.
In other words over 95% of the time crypto is going exactly NOWHERE. While retail chumps and HODLERs make wild guesses as to where it’s heading next.
Eventually, after extended periods of going sideways, one side ends up exhausted and the market kicks into gear and starts driving in one direction.
In crypto that break out usually happens out of blue and catches everyone by surprise. And by the time most folks realize what’s happening the bulk of the move has already completed.
Also known as ‘ramp & camp’.
Which also means that sideways markets happen a LOT. Clues for recognizing that you are in or heading into a sideways market are as follows:
– Overlapping bars.
– Long wicks
– Alternating red/green candles.
– Sudden changes in direction.
– Confusing price action which is hard to interpret, all of which indicates that there is a tug-o-war between participants.
– Inside and outside bars.
No matter what market you are in, range bound markets are wars of attrition.
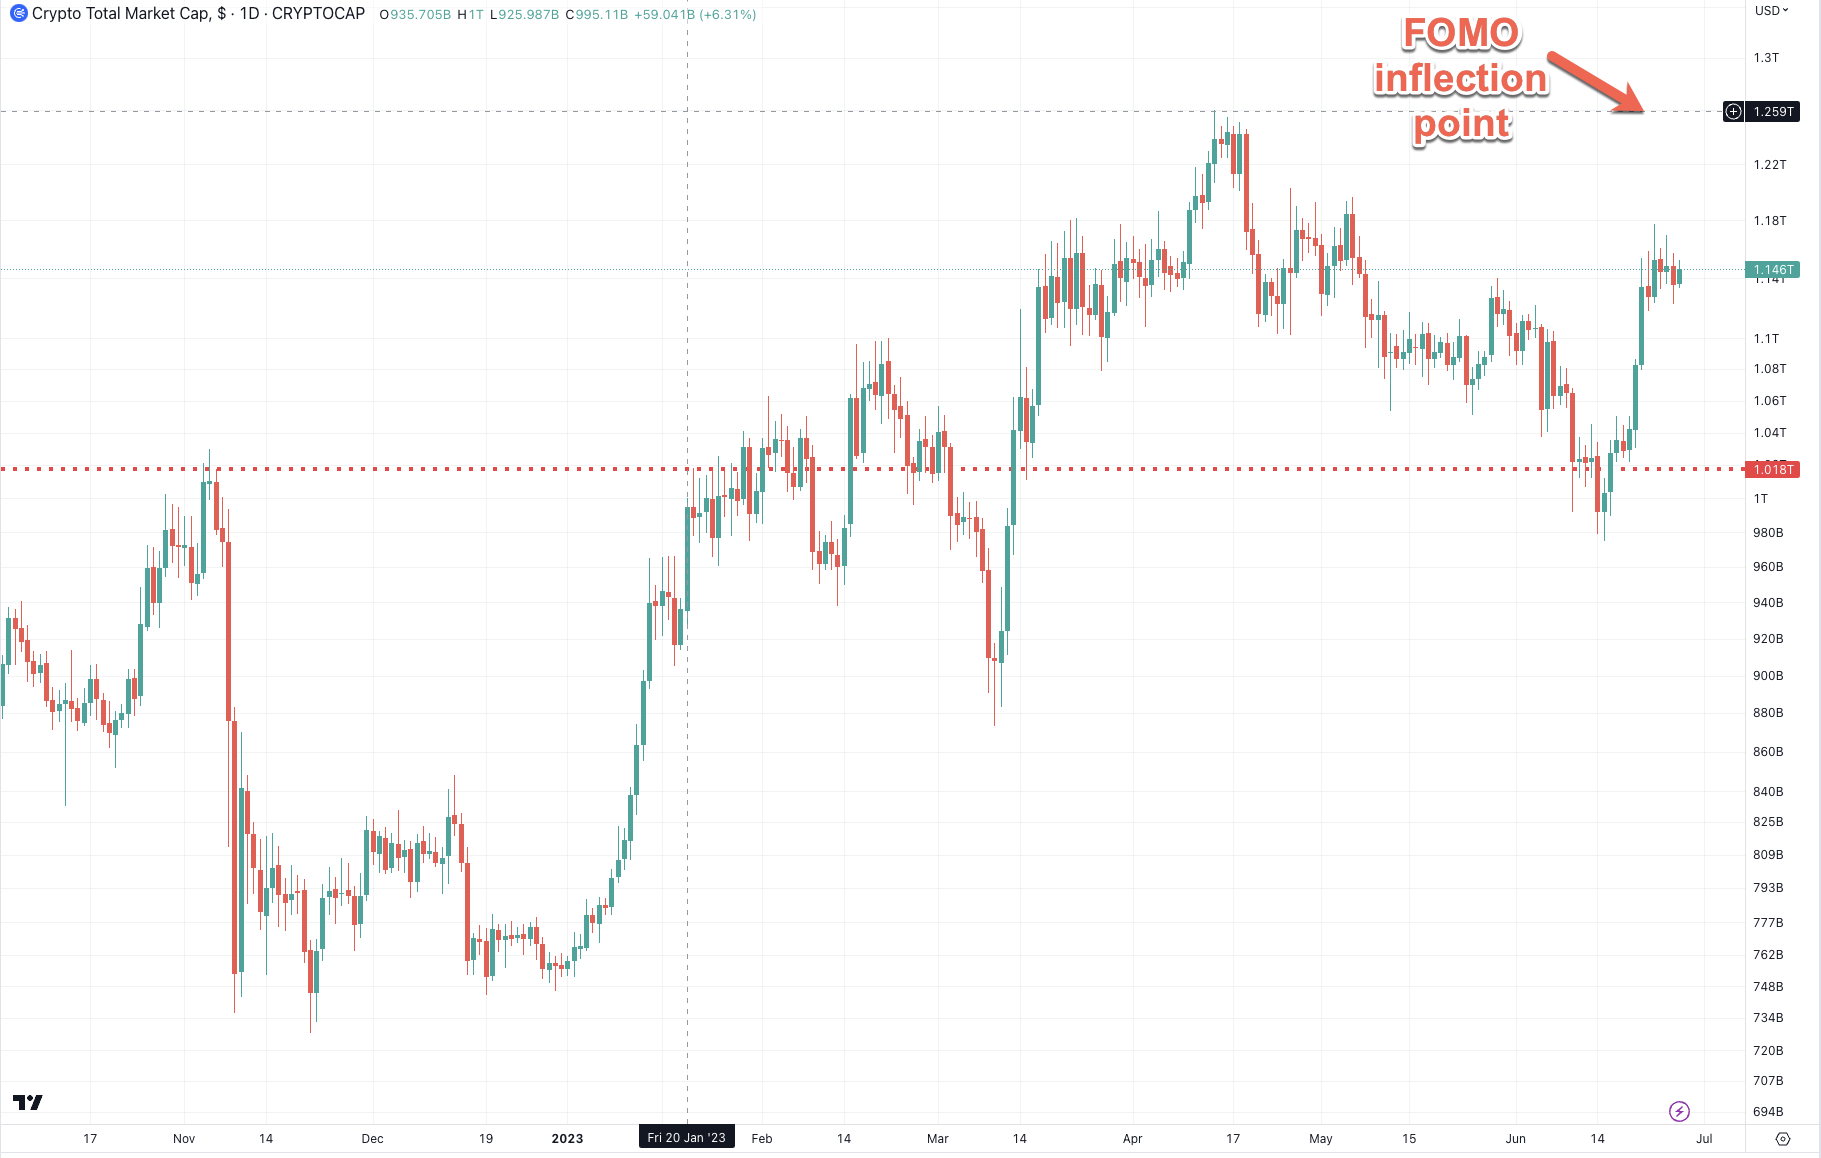
And by definition every range bound market has distinct reversal or inflection points.
Look at the TOTAL (all crypto) chart above and see if you can point out a few of them.
As you can see I already took the liberty to highlight where I believe the normies are going to start to FOMO on crypto again.
By that time we’re already well positioned and in the green, because the bulk of the move has long played out.
So how do you catch those juicy moves in the first place?
What I usually do is look out for exhaustion bars followed by confirmation bars. Those are great to place your stop and find an entry.
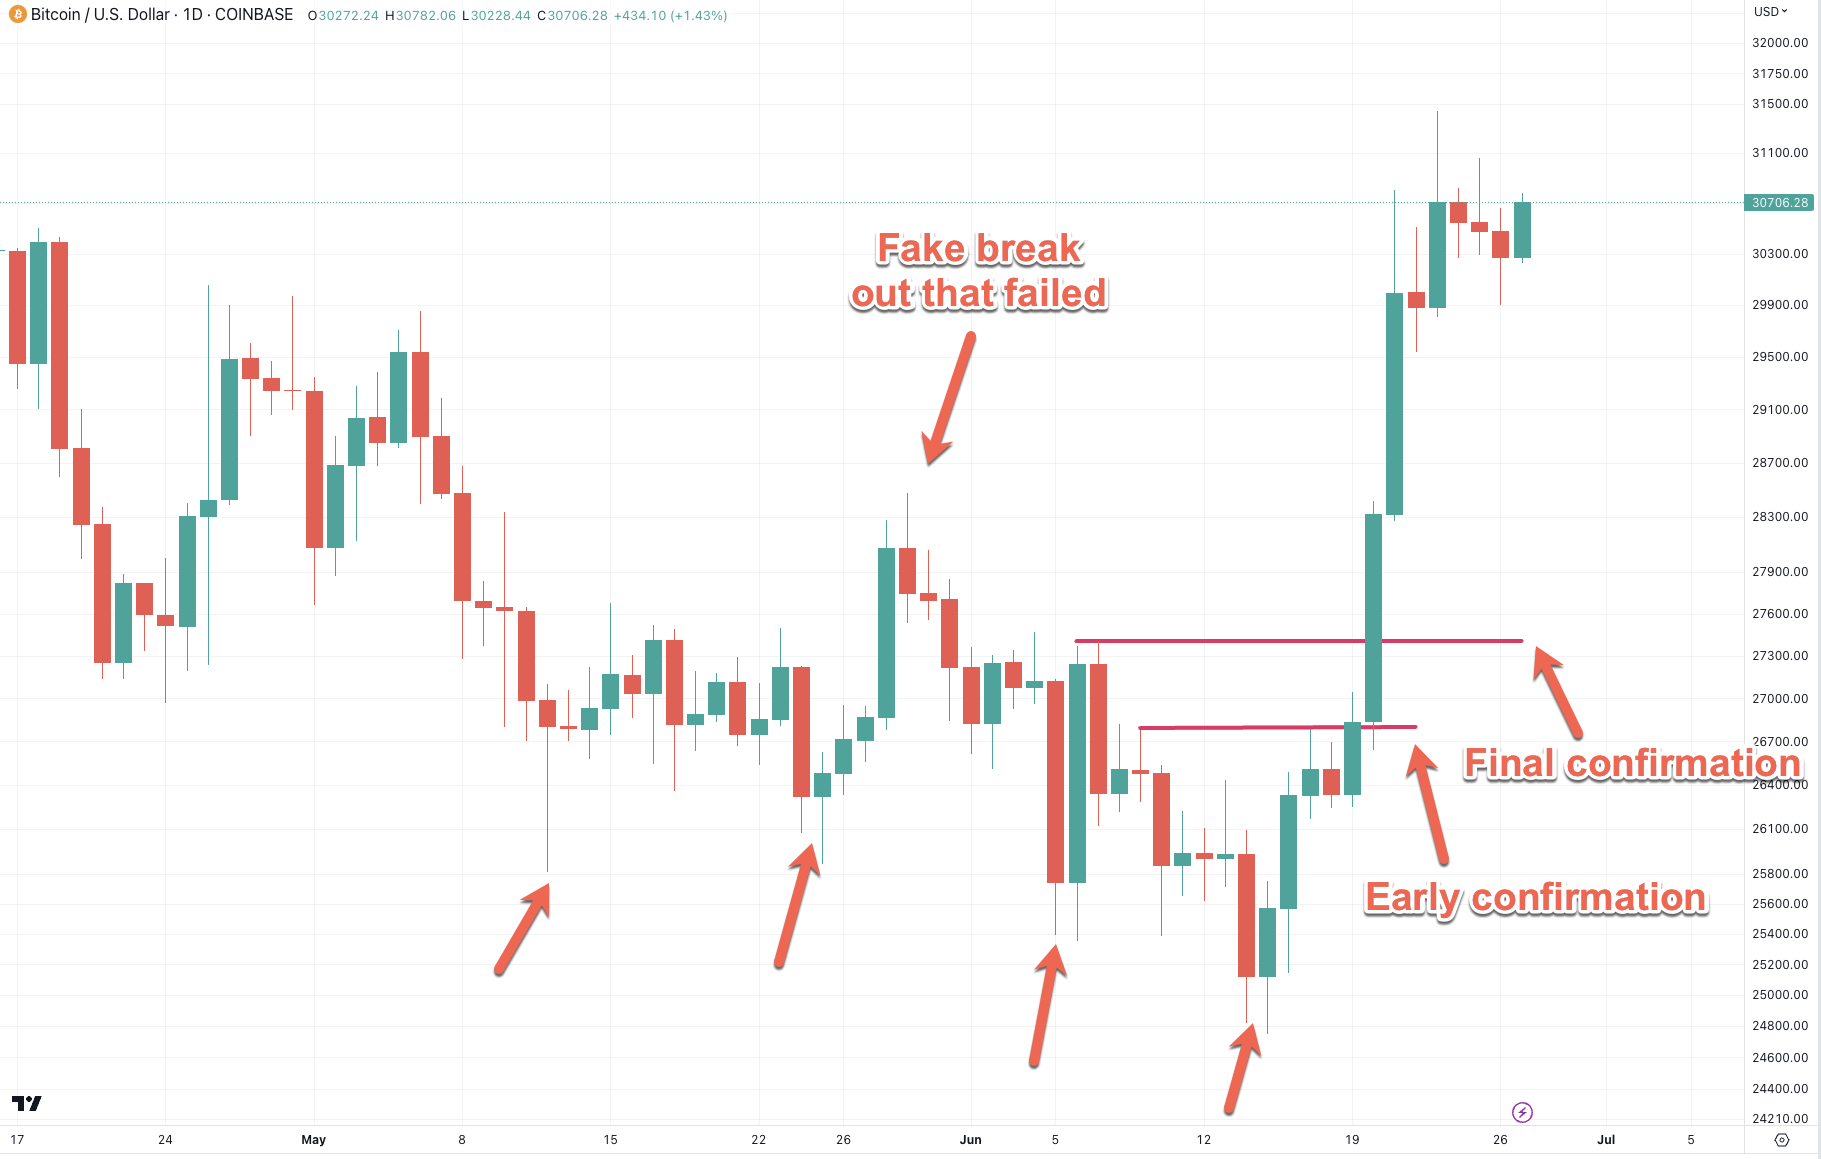
So for example on the bottom of the chart above you see a bunch of times where prices appeared to have reached max exhaustion.
Once there was a break out that failed and gravity set back in (yes it happens).
But then about two weeks ago we saw three candles in a row that appeared to hold the line.
Possible selling exhaustion and good place for your stop loss.
Now you simply look for a breach above a previous spike high or whatever price pattern floats your boat.
I personally prefer spike highs as they are easy to pick out.
Those types of mini price extremes often serve as an inflection point. If they are conquered a lot of people end up being wrong which leads them having to cover.
That is how equilibrium breaks and the market once again turns directional.
If you’re on the top of a trading range and it pushes higher people are going to start covering, which again produces higher prices, which causes others having to cover, and so on.
The main take away from all this is that price inflection points slightly shift the risk/reward ratio in our favor.
And that’s how you pick an entry.
If that sounds complicated or like too much work for you then there’s another option.
Pick a proven trend trading signal like Gravitas, which continues to kick a$$ and take numbers.
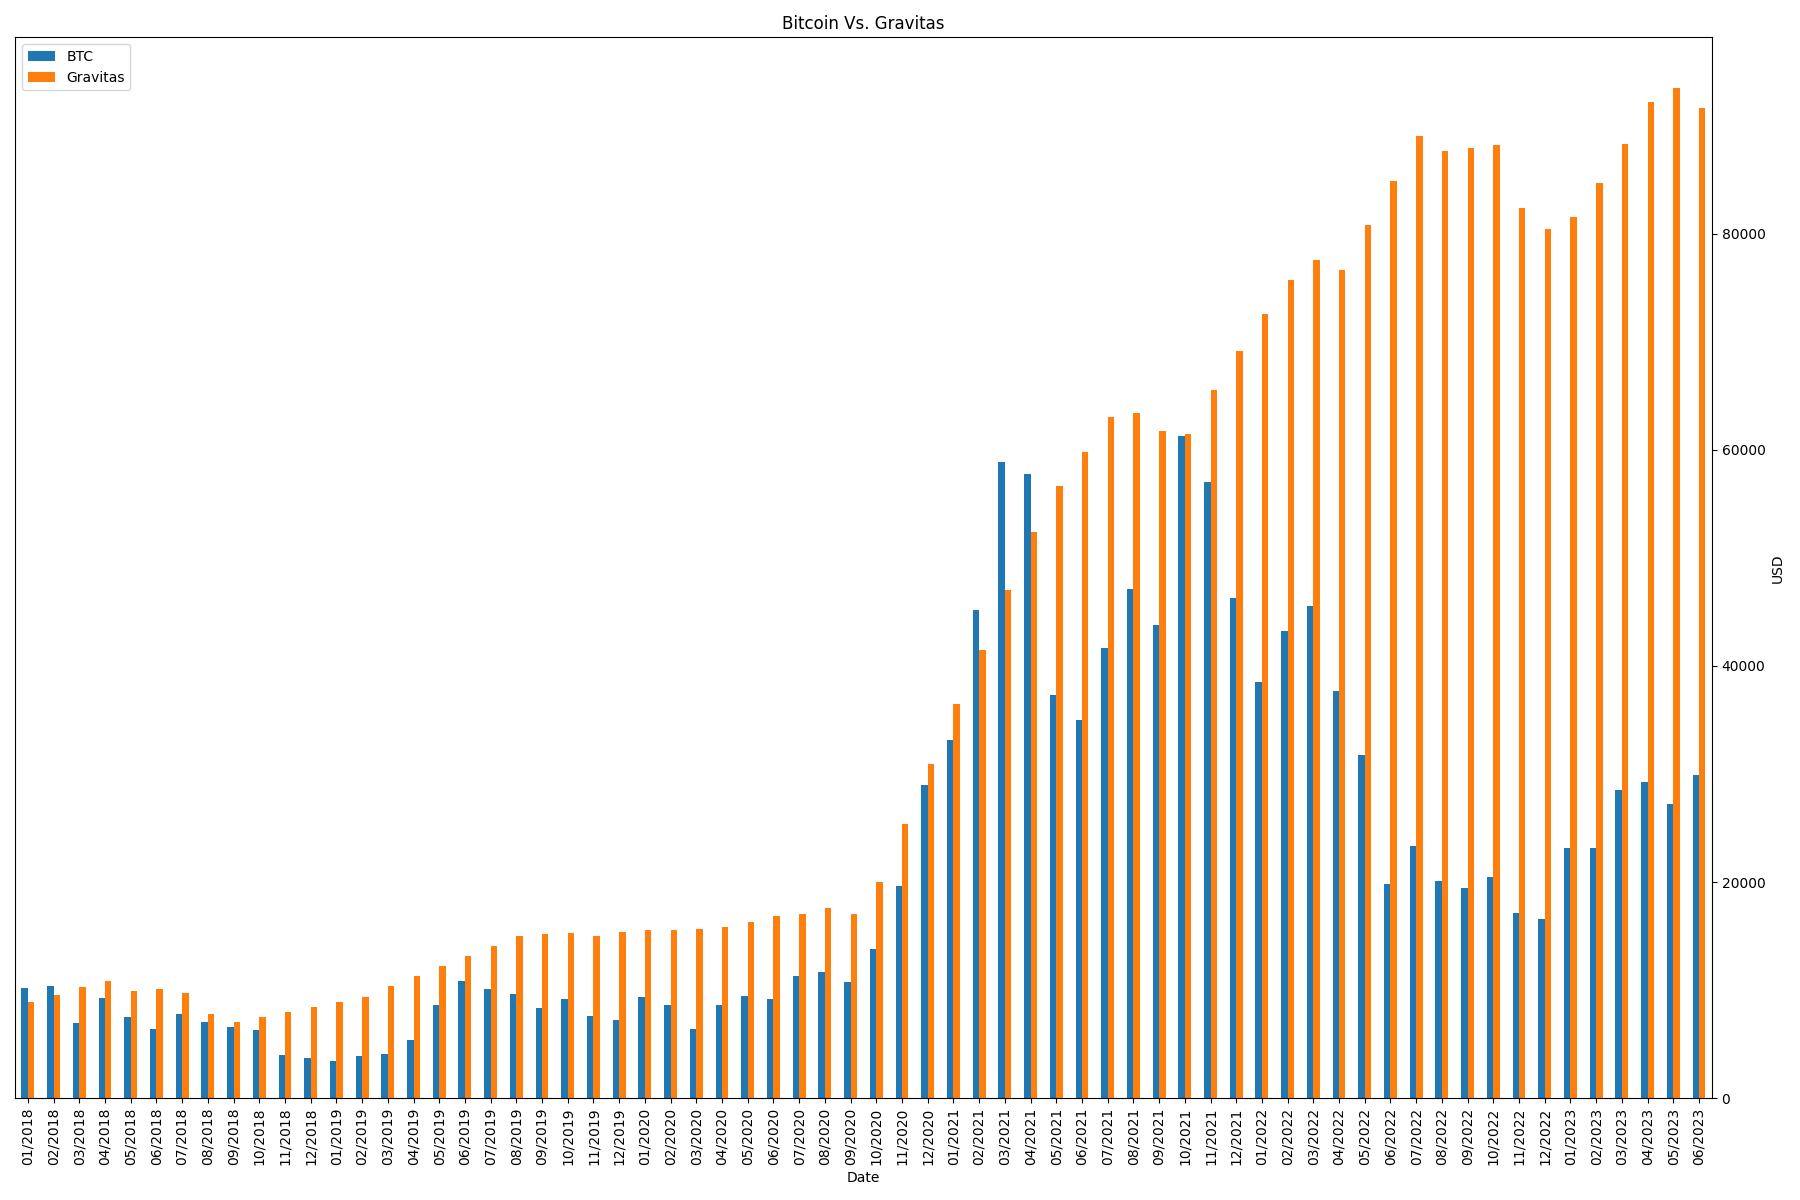
The whole idea behind trading the overall trend isn’t to pick tops or bottoms. It’s about remaining on the right side of the tape when it matters the most.
And that’s what Gravitas is really good at. Plus it’s a long term signal, at the very most you take action once per month on average. Perfect for the busy operator.
The results speak for themselves, so if you’re interested shoot us a message here and we’ll get you set up right away.
Happy trading and see you next time.


