


Is It Time To Sell?
Is It Time To Sell?
Take any modern retail trading platform and the ratio between views on the chart tab versus the on the trading tab settles in at somewhere around 7:1. In case you wonder – YES, I get off on exotic statistics, because that’s just how I roll.
That plus it’s officially summer now and just like in every June I’ve barricaded myself inside my house with curtains and blinds closed until at least September.
I’m only half kidding (I hate the heat), but let’s get back to those stats.
Because a ratio of 7:1 between chart and trading data tells a very sordid tale of suggests most retail traders continue to be attracted to wiggly-blinky things, as opposed to the under-the-hood stuff that actually matters.
“But Mike, you handsome all-knowing devil”, you say, “everyone’s looking at charts, plus you are the one posting them!”
Yes, guilty as charged. But if I didn’t post charts I would probably command an audience of exactly 7 autistic stats nerds and 1 hyper gifted purple crab.

(Jerry never misses a post)
But you’re right, I do look at charts every single day. What you don’t know is that I look at an equal amount of trading data and statistics as well.
In fact it’s the latter that often leads me to posting a chart or a specific trading opportunity.
Now why am I bringing all this up in the first place?
Because there’s one question I keep getting over the past week or two, and you probably can guess which one it is.
“Hey Mike – the market has been on a rampage. When is it time to sell?”
Oh gee, that’s easy. Let me consult my crystal ball….
… which is still in the shop. Damn it, that means we need to fall back on our statistics.
Now before you run off screaming in terror let me assure you that this is going to be quick and painless.
And I promise there won’t be a test at the end. Okay maybe.
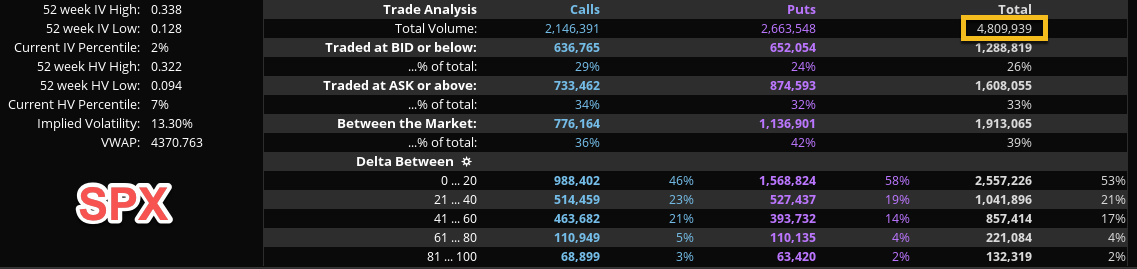
So what you need to understand about order flow is that the SPX along with the Spiders represent 1/4 of all the contracts traded in the market.
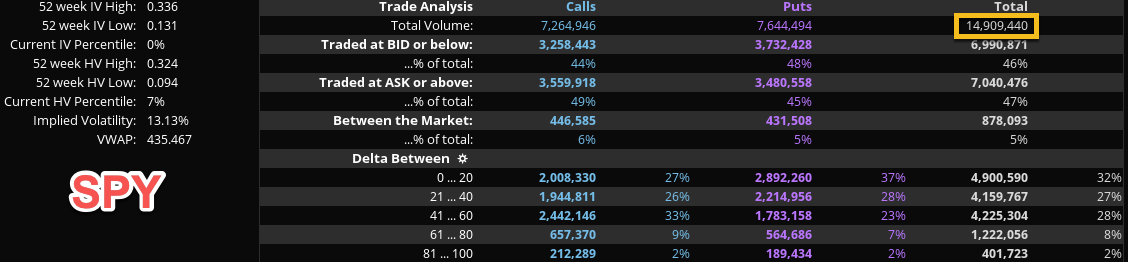
Meaning if you have a typical trading day of ~47 Million contracts traded (avg. for June of 2023) then 1/4 of that, or around 12 million contracts, can be attributed to both the SPX and the Spiders.
Of course it varies quite a bit from day to day. For example yesterday the two combined racked up nearly 20 million contracts.
I know what you’re thinking. “And why exactly would I care about that?”
Fair point, but I promise we’re getting to that.
Right now.
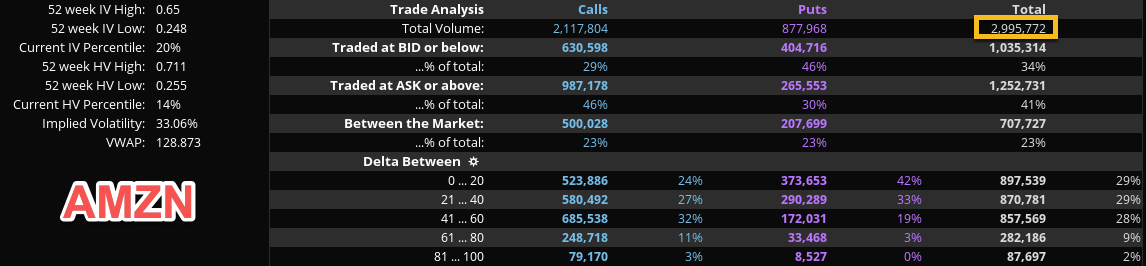
Let me show you some of the top three stocks traded. Here is AMZN: Nearly 3 million contracts.

NVDA: Nearly 1.8 million traded.
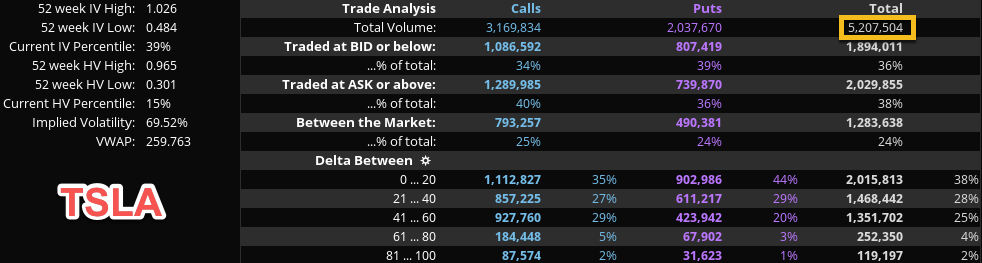
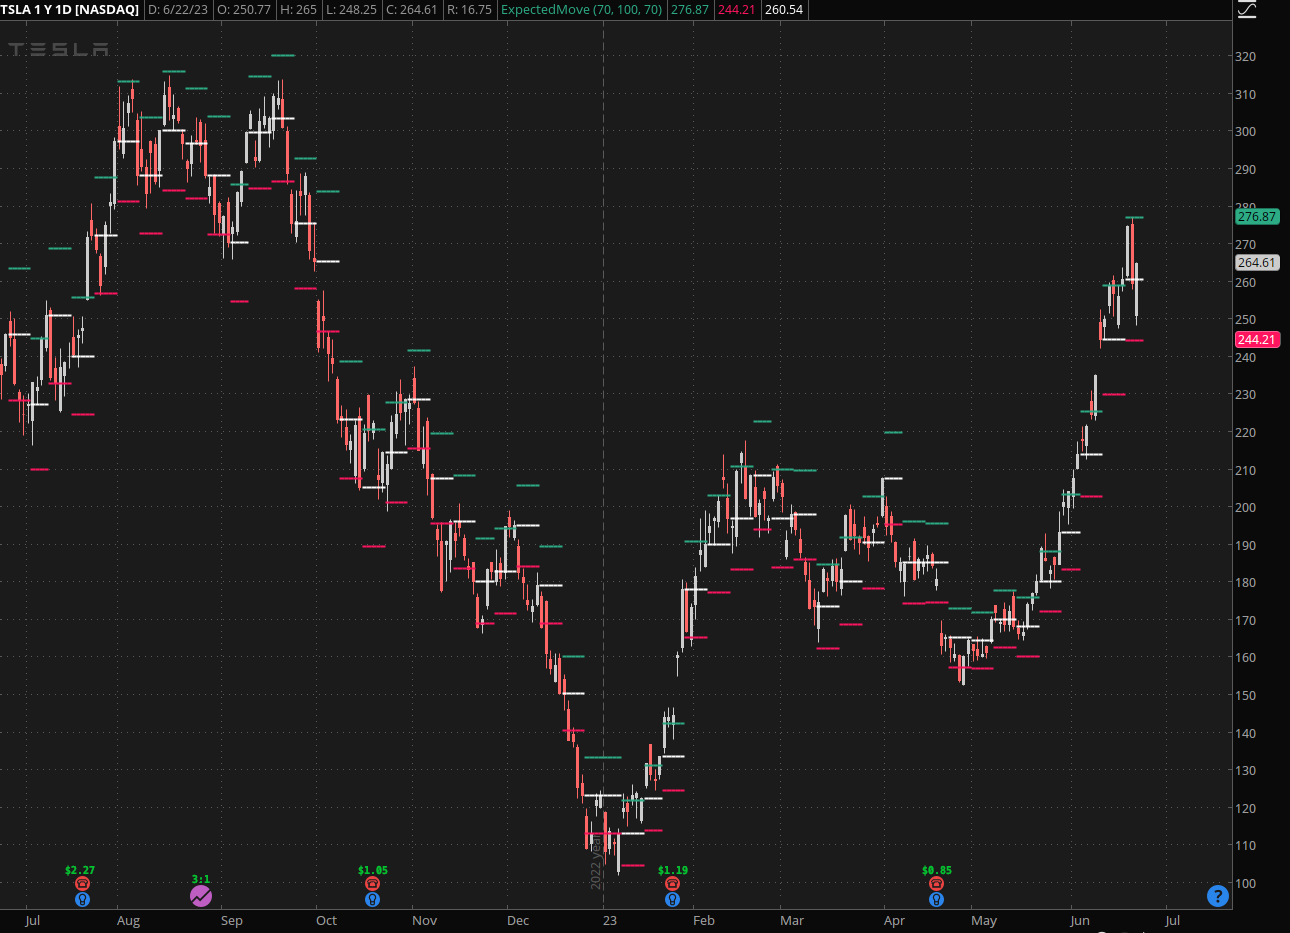
Kept the best for last: TSLA with a whopping 5.2 million contracts traded.
In one day.
This is real. This is happening.
But what does it mean?
Well, do the maff: 3 + 1.8 + 5.2 = 10 million contracts traded between TSLA, AMZN, and NVDA.
Effectively 3 stocks represent 1/5 of all the options, stocks, and futures traded in the entire stock market.
And that, boys and girls, is that they call weak or low market breadth.
But it gets worse, much worse.
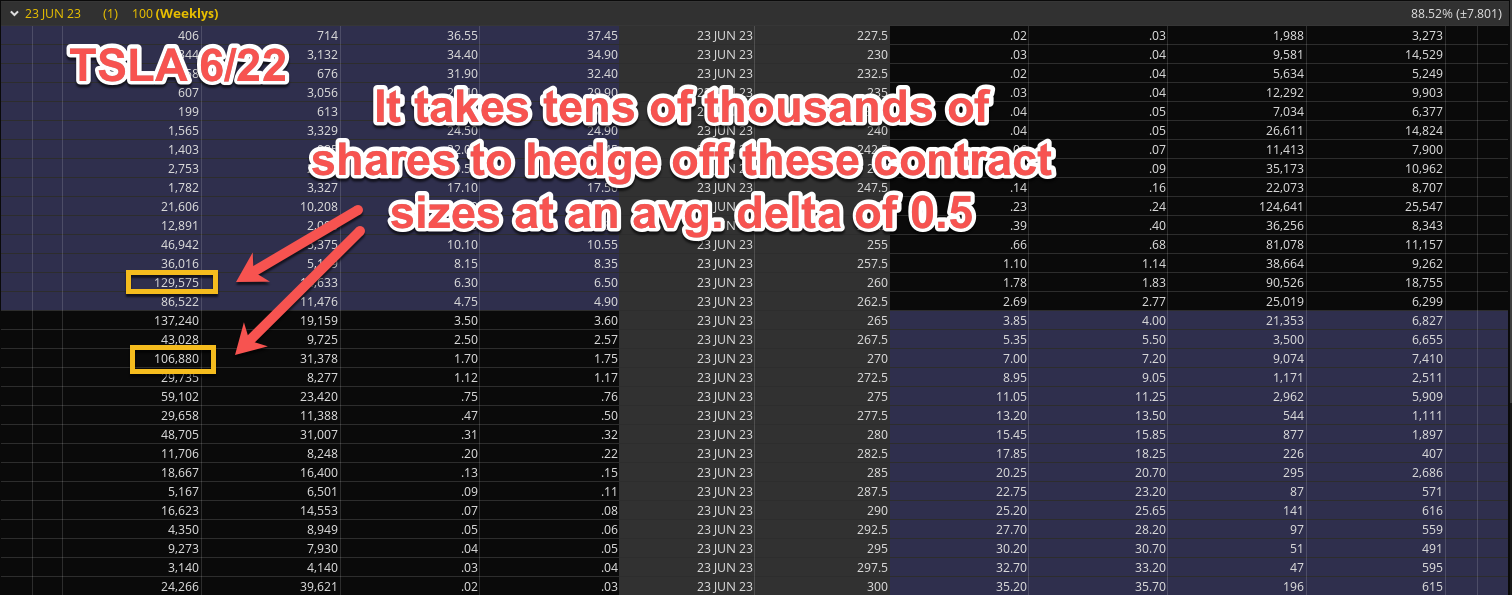
Here’s the closing view on the TSLA weekly option contract which expires today. You’ve probably heard about 0DTE by now, as it’s been all the rage lately.
And by that I mean it’s what institutional traders have mainly been focused on over the past year or so, basically since post COVID.
Look at those contract sizes on the 260 and 270 strikes. Do you have ANY idea how many tens of thousands of contracts it takes to hedge off such massive positions, especially at an average delta of 0.5?
Now if that sounded like Chinese to you, then you’re forgiven.
What I mean is that it takes an sh…load of actual stock positions to hedge all those call options they sold to who knows who (retail and institutional combined).
Which is why we keep seeing those massive uni-directional moves that often turn on a dime.
It’s all flow model and sector rotation at this point.
And honestly I can’t blame them either. In case you have been hiding in a cave over the past three years: we live in very strange times and crusty old concepts like market cap, P/E ratio, or P/B ratio have long been relegated to the past.
Along with common sense, but I digress.
My point in posting all this is that I just answered your question, at least if it related to whether or not it’s time to sell.
On the surface this market looks bullish AF and you simply can’t be wrong by buying the top 3 or 5 top symbols and then call it a summer.
Oh boy, I wish it was that simple. But it isn’t. Because low breadth manias based on a collective market diopter of minus 7 can run for a very long time.
But let me throw you a bone and I think it’s a juicy one.
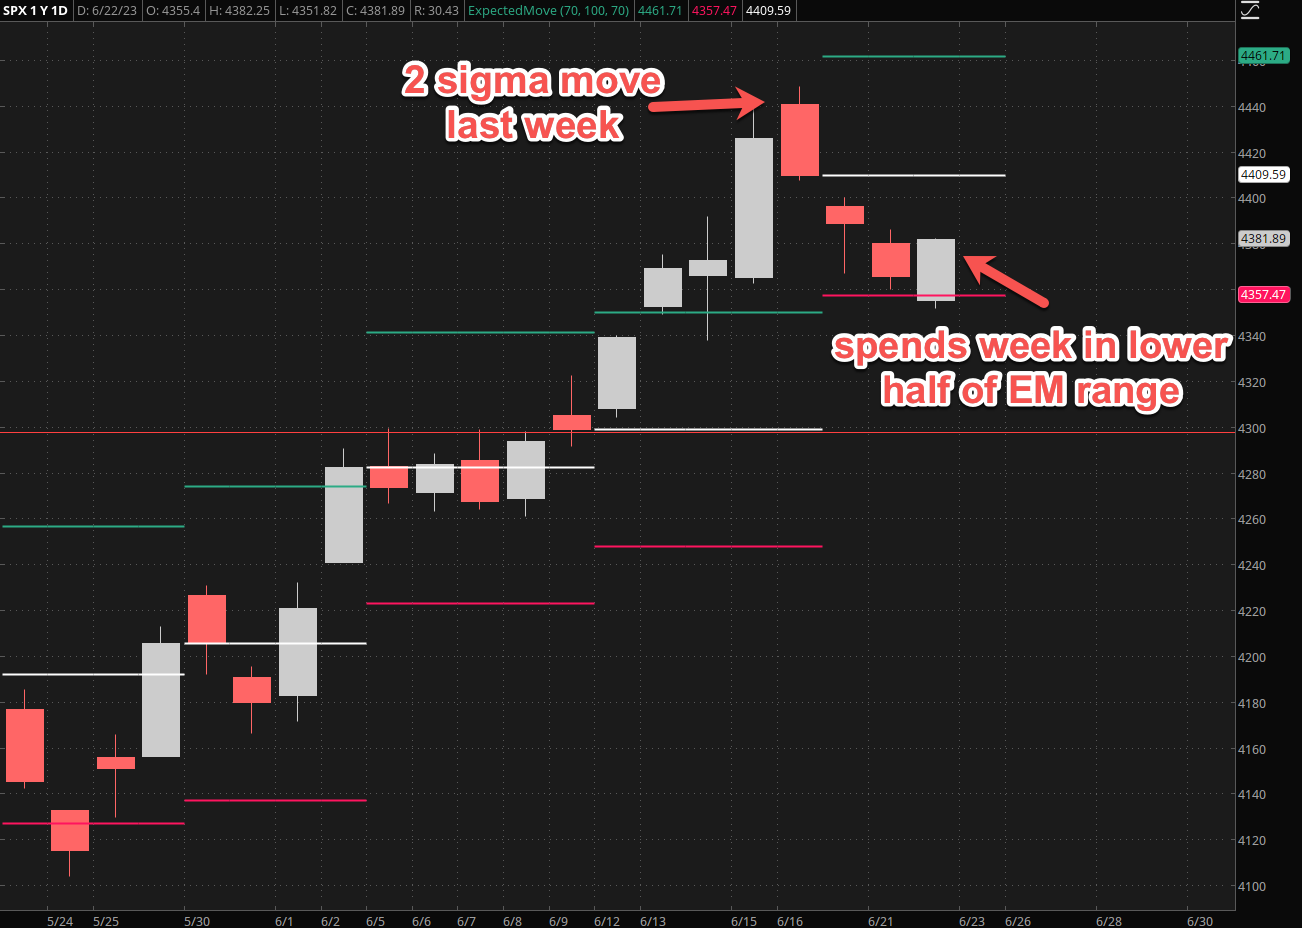
The time to sell will be when we start cracking the lower range of the weekly expected move.
Why is that one important?
Because nobody really trades based on a 30-day window anymore. 7DE and most recently 0DE is the name of the game now.

Which is why the VIX – on its own – really isn’t that important anymore.
That said, the ratio between the VIX and the VIX3M (formerly VXV) has now dropped to record lows. Guess what usually follows?
Hint – it’s not pleasant and requires large quantities of vaseline. Unless you swing that way.
Anyway, we almost cracked the lower EM range yesterday but then quickly snapped back.
Gamma risk is a thing, and those ranges are always heavily defended.
ESPECIALLY on the downside, because things have a tendency to get out of hand quickly in a market that’s driven by bad breadth.
Bottom Line: If you see the SPX close the week below the lower weekly EM, then it’s GO TIME.
Until then, keep your powder dry.
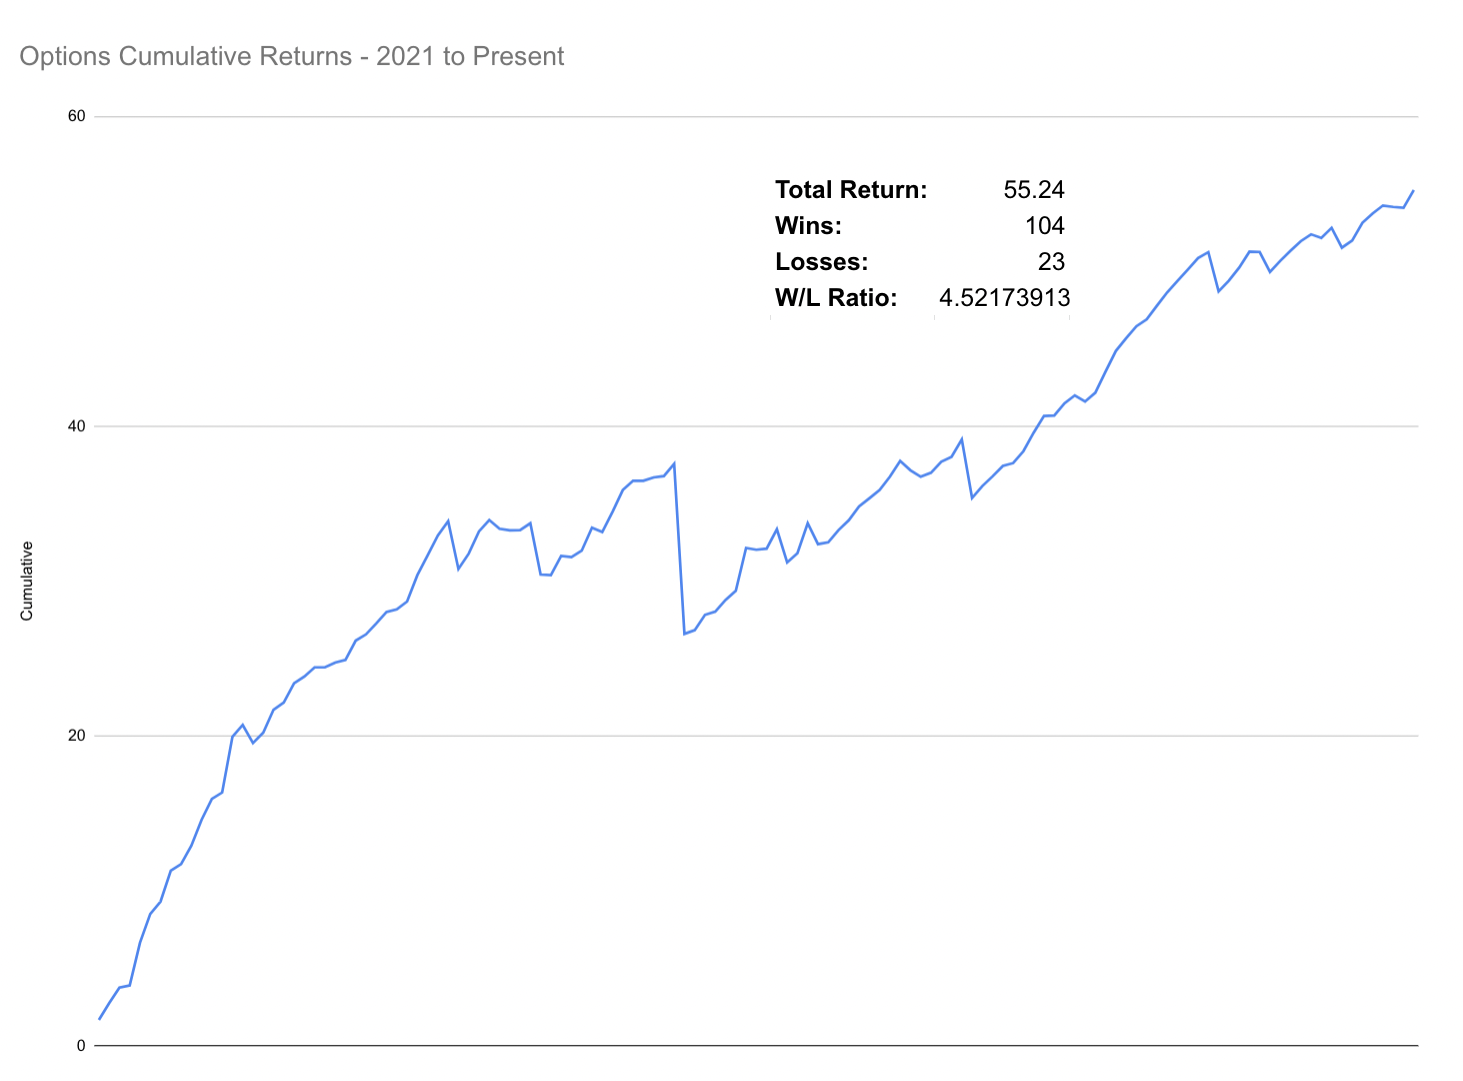
BTW, if you enjoy this type of analysis and are looking for returns like the P&L above then shoot me an email and we’ll get you set up in no time.


