Catalysts and Cattle Lists

Let’s go ahead and say the least – this was a beast of a week in the markets.

First let me say – I wasn’t the first guy to turn bearish on stocks, but I do like my killing to be easy; especially since markets have a way of chop-dropping downward with greater velocity than they do in fact rise. So at the risk of refreshing my status to born again idiot, I will admit to you now I’m beginning to turn a lot like bullish.

Michael Davey here, Inviting haters ;)

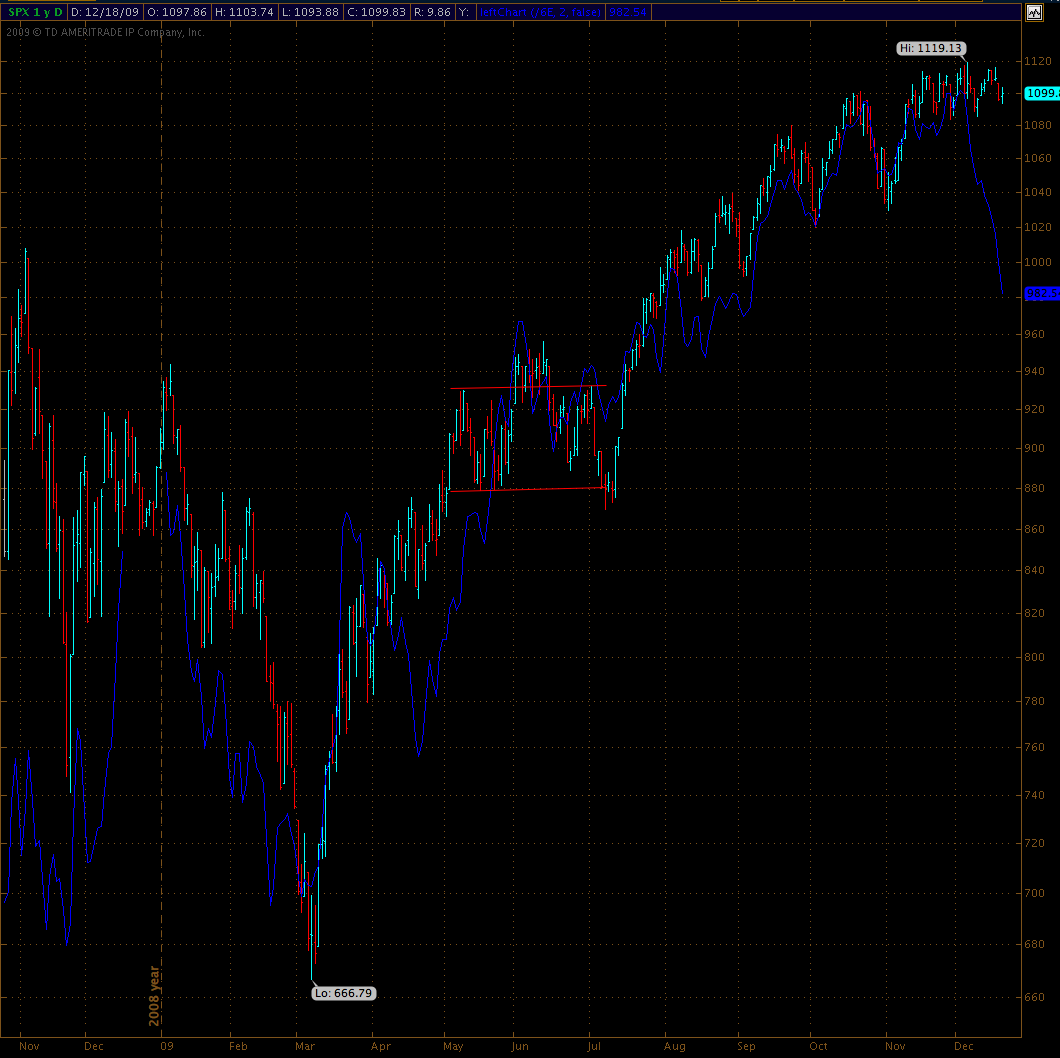
Looking back to last Friday, the SP500 Cash had closed the previous session at 1102.35, before the US Dollar began to rally (Dollar began rallying Friday before the open in US equities). Since this time, currencies have shifted rather wickedly, with the Dollar jamming higher and higher, before jamming higher again; then vacillating on both sides toda, only to end up flat for the session.

This in and of itself is not so fantastic. We knew there were something in the neighborhood of 95% Dollar bears. Given this is the largest market in the world and everyone was firmly cocktailed to one side of the ship, it didn’t take terrific amounts of genius to anticipate a potential Dollar rally.

This was a large part of my bearish/cautious stance on equities; combined with multiple signs of distribution, leadership turning lower (the Financials especially) and sentiment measures illustrating a nervous high-number of bulls and a historically low percentage of bears (which is negative).

Pretty clear to me was that if the Dollar began to punish over-saturated shorts, then equities would define why you pay attention to things like distribution, leadership and sentiment.

Equities would certainly get crushed.

Here we are though, having now witnessed a one-way, one-week surge in the Dollar, potentially signaling the end to the Greenback carry-trade, and the SP500 cash just closed the week at…1102.47.

You guys like difficult math I know. This amounts to about 1.5 points, or an entire .14 of a full-on percent.

Now before coming out and ringing any bells, I did try to find historical precedent whereby the de-coupling of the Dollar relative to equities was demonstrating a looming negative. I’m still looking in fact, but I’m finding nothing. If you know of any data on this, please send it my way (I’ll add an epilogue to this piece, and maybe save myself from myself at the same time). In the meantime though, I remained impressed that equities refused to sell-off in the face of a rapidly rallying Dollar and that we are but a stone-throw from the top of the 3-month trading range.

Yes, distribution, leadership and sentiment remain overall negative. Bears have that still to hang their hats on this weekend.

But I also want bring up something which has been pecking away at my intuitional insides lately. There is a rising theme building with market pros and it goes like this: “We would expect a market correction in the early part of 2010.

I heard this more and more these last few weeks, but this morning there were 3 new guest-heads on CNBC suggesting this same thing – that stocks will finally see a correction, early next year, but longer-term this will be a good buying opportunity. This smacks a lot like the sentiment in late March, when pros were bullish but because the market had run up so fast, they wanted to see a pullback before buying.

Smack smack smack.

And while this anecdotal survey of peer pros in and of itself doesn’t get me too juiced, when combined with a market simply refusing to break-down in the face of a big catalyst (Dollar weakness abated), it captures my attention (since pros are looking at a consistent scenario and the market is pointing to something else instead; I love to go with the market in cases like this and leave my peers behind!).

Peek at the decoupling illustrated in the above chart. If I could have seen today’s graphic this time a week ago, I would have grinned lascivious last weekend, knowing I was about reap sick profit with my handsome shorts.

I don’t think most participants realize just how resilient a feat the equity markets managed this week. If the Dollar does re-trace now, what does that say for year-end holiday strength?

Smack, crackle and pop.

Either way, while I’m not going to cement my mind to this view, but I’m becoming rather ambitious again for long-side prospects and especially for prospects “early next year.

True, seasonal patterns this year have largely been turned upside-down. Combine that with an investor public expecting weakness early in 2010 and we might just see uncharacteristic weakness late in the month here. So I’m going to keep that in mind before getting carried-away long.

Wow, not kidding, just now on Fast Money another trader pro is arguing for a 10-15% correction in stocks…beginning early January. That’s 4 heads now in just one day, saying exactly the same thing.

Good weekend – Beast out.

This entry was posted on Friday, December 18th, 2009 at 6:47 pm and is filed under Market Outlook. You can follow any responses to this entry through the RSS 2.0 feed. You can leave a response, or trackback from your own site.

  • gmak
    We will quietly turn our pages to the next post.

    http://evilspeculator.com/?p=13753#disqus_thread

    NEW POST
    NEW POSTNEW POSTNEW POST
    NEW POST
    NEW POST
    NEW POST
    NEW POST
  • tradejane
    Christmas parties are evil. There's a headache just above my right eye that won't go away but as far as I can tell the DAX is up for today, trading close to 1st resistance of 5878. 2nd resistance is 5924 area. Pivot is the 5853 and 1st support is 5807.

    I didn't see any important numbers coming out today but tomorrow should offer some excitement in that area, with US, Britain and New Zealand GDP numbers coming out.

    Top sectors in Europe at the moment are Oil & Gas, Basic Resources and Banks. The latter being a little misleading. German banks are flat and about to issue a sell signal. The Austrian Raiffeisen and especially AIB are deep red. AIB in particular seems to be in dire need of a bailout.

    I'm sure Santa will think of something.
  • OK, just I quick thought....the solstice's and the equinoxes are important. Dec 21 is the shortest day of the year for sunlight.

    Also, back up your f'n computer and do it now. Mercury is going Retrograde, and no BS....my stalwart computer blew up last retrograde. Serious. Do it.

    http://oahutrading.blogspot.com/2009/09/computer-backup-before-mercury.html
  • Sorry guys - I popped by this afternoon, saw the comment count, and decided to not post. It's a few days before X-Mas and it seems only SOH is really busy.
  • Nightwind
    /es is forming a triangle on the daily. I'm guessing an upward breakout then possibly a reversal just after it makes new yearly high. That is the type of bullish pattern that I could short even with Mole's money.
  • goldpackers
    I have been watching the triangle formation also on spx. If so, believe we are in b of E. 1090/1092 favored for E. Below 1086 and triangle invalidated.

    Bearish count is 1116 was a failure and top is in. Again, 1084/1086 is key. Had a turn due today and 12-24/28.
  • yudhisthira
    In the triangle, you are saying we finished wave e on friday?
  • Nightwind
    No, I'm expecting an upward breakout with a possible reversal on a new high. I'm looking for a failure of a bullish pattern. The bulls will look at this as a consolidation pattern before making new highs. I look at it as a possible bull trap.
  • kostee
    Nice sandbox to play in. Too all happy solstice. kostee
  • charles_smith
    It's quiet... too quiet. Maybe those starving (polar) bears got to the North Pole and ate Santa's rally....
  • I condensed the entire American Financial History into a 10 minute bullet item read. Have at it.

    http://oahutrading.blogspot.com/2009/12/10-minute-chronology-of-important-us.html
  • T_I_E
    THE Dollar and $SPX

    Take a look of the long term dollar charts from a guest post at Naked Capitalism. http://www.nakedcapitalism.com/2009/11/guest-po...
    and then a long term S&P chart.

    The obvious observation is the dollar's long term down trend and it's very likely we could see 63 or even 55 $USD in the next three to five years. The severe decline in the value of the dollar reflects the long term decline of the credit worthiness of US government and the possibility of a dollar collapse is not a rare event according to this chart although I wouldn't bet a total collapse of the dollar in the next 5 years.

    By comparing $USD and $SPX, a very interesting and very important discovery is the correlation between Dollar index and US equity markets could be described as best to none. From Sept 85 peak at 164.72 to 87 low at 85.42 of $USD, S&P almost doubled from 180 to 340 before it crashed in the Black Friday. After the crash both the dollar and S&P moved lower until Dec. and then both moved higher from Dec. 87 up to June 89. In the next three months $USD pulled back and rallied while $SPX kept making new highs. From Sept 89 to Feb. 91, dollar kept falling while S&P had a 15% pullback then rallied to new highs and then a mini crash and rallied back. Between Feb. 91 and April 95, Dollar moved up and down (reaching slightly a new low) in a side way range while S&P mostly higher. After 95 both S&P and Dollar moved higher and accelerated into 2001 tech bubble. During 2000 to 2002 market crash, Dollar mostly moving higher. During the 2002 to 2005 dollar free fall, market marching toward another bubble. Equity markets kept higher during dollar's brief rally from 05 to 06. Everybody knows the story after 07.

    Here are my interpretations of the relationship between Dollar and US equity markets:

    1. There is a huge "negative divergence" between dollar and equity. While $USD depicts a dire picture of the healthiness of the US economy during the past two decades, the $SPX clearly shows the exuberance of investors over US corporations during the same period of time. At some point, that huge negative divergence will play out and both dollar and equity will move lower.

    2. The equity bubbles and its subsequent crashes are associated with both rising and falling dollar environment.

    3. The current rally of S&P from the March 09 low to the current 1100 area is just a part of a new bubble. Since it takes 3 to 5 or more years to build the bubble, the current rally could still be in its early stage. The correlation between the dollar and equity will be pretty loose in short term (the next three to six months) with $USD trading between 75 to 80 while $SPX between 1025 to 1120.

    4. Bubbles will burst after all and the equity will fall back to where the bubbles launched. Once $spx and $usd move in the same down trend, expect $SPX will fall back to 1995 level or 1991 level or 1987 level or 1982 level in REAL TERM not nominal dollar term. Using an inflation calculator, I find the adjusted price targets for the next $SPX crash at 630, 501, 428 and 321 respectively in current dollar term.

    5. Since Euro is 57.6% of the dollar index, a short term rally in dollar due to weakness in Euro as we are experiencing now does not reflect any strength in the credit worthiness of US Government. Expect Gold price will remain elevated. ( Please wait for my next post The dollar and Commodities). Expect yields of long term treasuries like 10, 20 30 year bonds rally dramatically. ( Will do a post on that)

    6. Stagflation is the only outcome due to US fiscal and monetary policies. Expect stagflation starts within 6 months and last about 8 years.
  • bubble jeopardy
    The divergences in the chart below have been good warnings of a trend change. Currently, a divergence exists and is warning of another trend change.
    http://www.screencast.com/t/YTQ2MTRiZj
  • gregn
    Thanks for that chart, definitely looks promising for at least a short term pullback.
  • christmas stats
    day - 5 up 65 % of time .2 avg
    day -4 little changed
    day -3 positive .1 60% of time
    day -2 negative .05
    day -1 though +5 are positive with 1 % total increase
    puts us at about 10600 by first of year - let's see how it plays out
  • after being bearish for months now I am suddenly bullish
    I think I should myself as a contrarian indicator
  • gregn
    Michael, I do not think that the carry trade is over based upon this week of equity strength in light of the dollar rally. I see the /6e decoupling with /es as a negative divergence, the equities were held up through opex to screw the Dec put holders. At least that's what I think.
  • bananaben
    This is my thinking too but I have also worried about the financial pundits calling for a correction early next year. Maybe it will fall apart right here, right now - i.e. next week. In addition, the correction that they call for is generally on the order of only 10-15% which is MUCH, MUCH less than what I believe will actually happen. So maybe that is still contrarian.
  • gregn
    A 10% correction is still nothing to sneeze at. I would be happy with a correction of that magnitude. We would be at around SPX1000 and DOW9000.
  • fast996
    The anti-santi case is growing....asian contagion??

    fast

    http://content.screencast.com/users/fast996/fol...

    Edit

    I'll just add the coup de gras here. This diamond top also appears in the Dow global index. Poor Santa has problems.

    http://content.screencast.com/users/fast996/fol...


    http://www.screencast.com/users/fast996/folders/Default/media/0d52a1c5-e7d7-4f90-b823-0ea404b26a7a
  • may your coup de gras allow us to have fois grace for Xmas ;-)
  • gregn
    Interesting charts, thank you. I haven't seen anyone chart GDOW on here.
  • fast996
    gregn, you're welcome.

    fast
  • The_Grim_Reaper
    Here are some CPCE expectations. Looks like the same setup as 2003-2004

    http://stockcharts.com/h-sc/ui?s=$CPCE&p=D&yr=10&mn=0&dy=0&id=p93635470954&a=180275067
  • The_Grim_Reaper
    Here's another technique of forecast modeling for the overall shape of the market for years to come. In fact, I have this forecasted years out.

    This can only predict the shape of the market, and it gives no clear timeframes. I have marked where I think we are. This was all pre-generated. It even had the shape of the crash built in and forecasted accurately. If I had plotted the crash, the very top of this shape has it near the top of where the crash started, so it's reasonable to assume 1250-1300 will be hit.

    If this turns out to be true, I would think there is a big rally coming, as odd as that might sound. Who knows if it will happen...

    Mega-Rally?
  • Grim....we need more than some scary rheoteric and a line chart....what are you basis this on?
  • gsavli
    you don't just look scary...
  • bergs
    Oh the conudrum! (where have we heard that one).

    Log scale
    Shows us back testing the dark blue trend line drawn off the two X wave bottoms.
    Kiss of death as we know it should we test and fall off the cliff.

    http://screencast.com/t/Mjc4MDkwO

    Arithmetic scale. Is my preferred for longer time frames. This shows us Rats we have a little room to rumble. Probably enough to get on Santa's lap just as he stands up to put on on his P3 suit.

    http://screencast.com/t/NjEzMDBjNmU
  • fast996
  • fractured and disjointed topping process/pattern.
  • bubble jeopardy
    The market looks like it has been walking out on the plank for the last two months. With the bb so tight everyone knows a big move is coming. The negative divergences continue and still allow for sporadic new highs. Few, if any money managers think that a rollover and collapse like the spring of 1930 could occur now. Therefore, instead of a walk directly off the plank, maybe a couple of indices jump higher in a head fake and then gravity takes over. We'll see...
  • The Chart of Charts is expressing "No Opinion".

    That said, this market action is obviously either a pause before a further climb or a top. That is pretty basic, no great wisdom. But there-in lies a good point--don't overcomplicate the market.

    The market is tricky, but the more you read does not necessarily help you understand or predict the market. You could spend all weekend reading blogs in the hope of gaining insight, but that extreme amount of "research" could actually be detrimental to a clear view. You are probably better off going to get some exercise, go on a 4 mile hike through the woods -- clear your head. And think about staying healthy, because if Primary 3 plays out, there is going to be some serious SHTF, and your overall health and energy levels are going to be factors in how well you and your family get through things.

    The fundamentals of the world financial situation are horrific. Mortgage rate resets on large pools of mortgages are entering a phase of big increases. None of the bank and risky asset problems have been solved...at all. Government just transferred money from tax payers to special interests, without solving any problems.

    That said, we made a "Top Call" on November 21th, review the Chart of Charts from that era.

    S&P closed at 1106 on November 19th. Now it is at 1102 courtesy of that final ramp job to create "Min Pain" to option writers at expiry.

    Distribution continues, from strong hands to weak hands. Interesting how Calpers just now made it against the rules for it's investment decision makers to receive gifts from "Investment Advisors" aka Salespeople.

    http://oahutrading.blogspot.com/2009/12/chart-of-charts-121809.html
  • Best comment I have read in along time. Thanks for that - completely agree, at some point more information is detrimental to keeping a clear/cool head.
  • fast996
    The Dow futures count best here, for the right now, anti-santi case.

    fast

    http://www.screencast.com/users/fast996/folders/Default/media/50556c8f-3764-46d2-877b-07e9e0a53591
  • charles_smith
    thanks for the charts, fast--all provocatively bearish. Like many others here, I have traded on both the long and short side this year and basically made good money when going long and had my head handed to me when short. Yet my gut feeling is that 12/18 marks a watershed of some kind--one last pump at the close, one last rally in the NAZ (boy do most of those Oracle clients being screwed by higher fees wish they'd swapped vendors last year) and one last "ignore the dollar, buy the dips" run to con the retail trade.

    I may get trashed Monday but I'm short.
  • fast996
    Charles said...

    "thanks for the charts, fast--all provocatively bearish."

    thanks Charles, I agree Friday's action sure seemed like the ole "one more sucker pump, before we pull the lever" .

    Can you see all my other charts too on the page,also??

    Thanks,
    fast
  • charles_smith
    yes, I like how you group them for easy viewing.
  • ...goldman sachs, who by the way, gave themselves a 40% cost of living raise, this week.
    (Why?)
    There are 60 corporate Senators and 40 non-corporate senators, the non-corporate are getting killed on bills.
  • For GS, but specialy for mole

    Sympathy for the dEVIL

    http://www.youtube.com/watch?v=4_zA7nukoZA&feature=related
  • gsavli
  • mediatik
  • elliott_surfs
    Thanks mediatik, a somewhat comforting read =) Was looking for topping patterns from the '29 crash that looked similar to what I think we're doing right now, and stumbled across an old article from Market Oracle.

    http://www.marketoracle.co.uk/images/1929-stock-market-crash-dow-chart-image005.png

    (direct article link http://www.marketoracle.co.uk/Article4886.html)

    The rounding shape at the 60% rally point looks pretty similar to what we're doing now...only on a different time-frame.
  • bubble jeopardy
    Good article and that chart is eerily similar to where we are now. I rate the odds of it happening to our market pretty high, simply because no one believes it can happen. Current sentiment suggests just like in the spring of 1930 that the bottom is in. I beg to differ.
  • elliott_surfs
    Thanks for checking it out Bubble. Do you think the structure of the pattern is more important than the length of time it takes to complete? The 60% retrace in '30 took place in 5-6 months, where as ours has dragged on for nearly 9 months now. Guess that isn't too far off...
  • bubble jeopardy
    The top we made in 2000 is larger than 29 and took longer to make so there probably should be no surprise thus far.
  • fast996
    A further response to raised with wolves(btw I know some gals like that), here is my up to date count in the emini. Notice that I have this large wave up,that failed to a new high,marked B. In this pattern that is the correct label, because the 1119 high was the actual top and there was a 5 wave motive down. Now the tweezer top up here was the setup to start a primary C down.

    Notice at the top today I have either 2 or a marked that is because, being a primary B or P2 depending on the stocks, a rotation is taking place, which is a topping process.

    Now if this is a 2 here there will be no doubt about it as the market should break sharly from here. But a little more work could be required here Monday because the 2 of 3 is always a unification wave to enable the majority of stocks to move down in the 3 of 3.

    I hope I explained this well enough.

    fast

    http://www.screencast.com/users/fast996/folders...
  • Dude, you post enough, consider getting an avatar. Appreciate your posts.
  • jreality
    This market won't top out until all the bearish bloggers have completely capitulated and vow never again to press the "short" button ever again. ;-)
  • No, that would be too obvious. Mr. Market is trickier than that.
  • Marc45
    I wouldn't read too much into CNBC or a sampling of blogs/newspapers. What I think points to a correction is the Bull/Bear indicators which are at bullish peaks. Also I'm seeing a lot of bearish sites turning bullish. This coupled with smart money exiting over the past month and what's left to push up the market.

    My feeling (and this is only a gut feeling) is that we'll have more shoes dropping like whole countries defaulting and inflation causing problems. Let's face it, no matter how much Ben wants to print a gazillion dollars, if inflation is a problem, he's gonna think twice about adding to it. Either that or he only cares about the market going up in which case we're all fucked.
  • another thing that might dumpster dive is gold goes below $1000, not anytime soon, but maybe eventually.
  • that would be the day....

  • charles_smith
    Good analysis--it's always a wise strategy to argue against one's bias. Look how many bullish setups Mole dug up.... That said, the bollinger bands have not just remained tight but they've edged down. So yes we could explode up and there are certainly drivers to support this. But the financials, which led the rally since March, are weakening and if they break their trading range down the market may follow. Mr. RUT is looking weak as well.

    Just as "everyone" expects a correction in early January, "everyone" also expects the PPT to keep the market flat to up for the rest of the year. Thus the most unexpected action would be a major decline next week, tossing coal on PPT/Santa's "guaranteed" year-end rally.

    There must be a million traders who are in cash "waiting for the market to identify its trend" so how short is this market? Probably not very. Too many Bears have touched the wires together this last few months, so a "short-covering rally" might be light on fuel.

    Just a few thoughts on the other side of the ledger.
  • Well said....BXK and XLF are very weak. And we know those lead. QQQQ is kind of looking strong, but there is distribution and assets jumping around, so that might be BS.
  • bubble jeopardy
    I would add $bkx as a leader on the downside just as it was in 2007
  • fast996
  • raised_by_wolves
    Sure, it may be as simple as that line holding. However, take a look at the same chart using a log-scale. The situation now looks more complex. I would suggest that a true repeat of what happened before and after the 2007 peak would look more like this:

    http://screencast.com/t/ZmQ1M2JiMWYt

    Are you prepared for a possible green arrow up?
  • fast996
    To put that LT chart in perspective, lets zoom in on the present situation with todays chart.
    Notice the EDT present complete with the final 5 wave thrust for wave e complete with exhaustion gap and breakaway gap down.

    Now common to this pattern is after the initial break of the lower trendline, most times you will get a kiss of the trendline back up in a final exhaustion move. this will also set up on certain instances the Large "c" down.

    This is the case here and the risk reward is at a maximum level with a stop on the short position placed about 1 pct above the highest level reached.

    http://www.screencast.com/users/fast996/folders...

    fast


  • raised_by_wolves
    Thank you for the detailed explanation. Since I'm already heavily short via long-term put options that I have no intention of selling, a stop above the highest level reached isn't going to work for me. Instead of a stop, what I need is a hedge against a breakout to the upside. I'm considering many different ideas for what that hedge will be and will decide on something this weekend.
  • spudthorpe
    I'm positioned similarly. On the assumption that eventually indices will decline sharply, but further upside is possible before then, I've been hedging my long-term puts by (a) holding shorter-term call options, and (b) scalping on the long side in my futures trading account. If/when indices finally start to descend, the gain on my puts will far outweigh the total loss on the calls. If we spike upwards first, the higher-delta calls hedge the put losses. If indices remain flat for an extended period of time... well, then I lose a lot of money, but I'm not expecting that scenario.
  • hey, wallmart and the others I blessed have rodent band warranty (whatever that means) even V is ok until it unhooks (but on that one it's minute to minute stop adjustment)
  • The_Grim_Reaper
    yeah, no luck for bears on this channel yet, bounced right off it

    http://4.bp.blogspot.com/_HI9vMxcgcpQ/SywaW8BmlsI/AAAAAAAAAII/zVNz3cnscW8/s1600-h/dailybullgrid.bmp
  • elliott_surfs
    That damned Mar 09 trendline support has held too well (saw it tested on ES today and bounced big)...
  • doggis
    the way i see it is that U.S. stock prices continues to be PULLED UP by seasonal forces, and down by the strengthening dollar. the net effect is not much movement at all. If the dollar had stayed flat, i believe the market would be higher than it is based on the seasonal pull. So the market IS feeling the effects of the rising dollar and it has neutralized the pull up, and has made us flat. i disagree with the decouple. I think they remain correlated.
  • raised_by_wolves
    Thinking that this rangebound market can't last forever and that the true breakout may be to the long side (a short side head fake wouldn't surprise me), I'm considering a short iron condor as a hedge. All I want is protection against a breakout. I'm going to spend some time in TOS Analyze.

    Edit: Call me crazy, but I'm thinking a move to as low as 1050ish could be a head fake.
  • raised_by_wolves
    Whether or not this actually plays out bullish, I think Michael has correctly identified that there is significant risk here for equity bears. Despite my "I want to win beartard award going into Monday" comment, I've actually been looking for more short-term long setups to hedge my long-term puts. That's why I'm going to spend the weekend looking for potential short squeezes.
  • Gold_Gerb
    I agree Wolfie, significant risk.
    Still, I read this today: "Once this rally has run its course the big surprise will be the Phase II decline and history shows us that Phase II declines are the most destructive. One reason for this is because with everyone believing that the bear market has ended, the Phase II decline takes everyone by surprise and as the realization begins to set in so does the panic."

    I will be patient.
  • raised_by_wolves
    Another question is, what are the advantages and disadvantages of hedging that risk starting Monday versus setting a conditional order to hedge if the high is taken out.
  • I like this thinking and is a lot why I'm not one of those saying a 10-15% correction will be a good opportunity to buy stocks lower. I'm more inclined to believe that once the trend is negative, it's all over
  • Gold_Gerb
    thank you for your input.

    My thinking has evolved into seeing 2009 as being like the eye of a hurricane.
    for those who doubt, Google "second wave of mortgage defaults"
    probably won't be as bad, but then - how much does one want to risk?

    I will be patient.
    http://www.psychologytoday.com/articles/200109/waiting
  • raised_by_wolves
    The question is, at what price level or % correction is there a phase change to a negative trend? I could see a correction down to 1050 though and then a move up to new highs.
  • I don't have a specific answer - I'm firing short every time I think the trend has changed. Once I fire and it sticks, I'm looking to just fire harder and pyramid down (lightening on panics and increasing again w any strength).

    ...that's the gameplan anyway; willing to miss a few set-ups in the meantime as long as I get into that groove when it is really working
  • raised_by_wolves
    While your game plan makes sense to me, our situations are different enough that I need a little (or a lot) different game plan for myself. Although game plans will vary, we all need a game plan. What I have just said is something like what you have said in one of your posts so I'm writing this more for me (and others) than for you. I hope you don't mind me parroting your wisdom.
  • Possible I am completely wrong also. There me be a phoney brkout and collaps or we may even gap down monday and it is over.

    I am interested w what you come up w though. Good chess problem, eh?
    ...leaving now for the evening.

  • buddhabill
    Give the shorts some rope, get them excited and invested...and then POW! Squeeze the heck out of them, rally the markets, get some sideline money involved, NOW we'll have a proper top.

    I hold a SPY Jan straddle, and a TZA April call spread, but am 75% cash waiting for direction.
  • raised_by_wolves
    A +1 SPX Mar 10 straddle is about nine times too expensive for my hedge, and a Jan 10 one is about four times too expensive. I could do an SPY one though. Any other suggestions if I want to bet on the market moving one way or another?
  • how expensive are MWJ calls? try getting some when mwj is 0.08 ounces
  • raised_by_wolves
    Now these look like sexy oven mitts to me—further OTM so lower probability but cheaper and higher potential reward—so sexy!

    http://screencast.com/t/ZWMxMDVj

    Ideally, SPX will fall to the bottom of this trading range or, even better, appear to fall below it, and I'll have an opportunity to look for the same sexy characteristics at a lower strike price.
  • raised_by_wolves
    As for MDY or MWJ verticals, I know they are like oven mitts to theta burn, but the risk/reward ratios just don't look sexy.
  • raised_by_wolves
    Good question. Let's compare with MDY keeping in mind that MWJ's underlying has up to 3x daily performance.

    As of today, here's what 600 bucks buys me:

    (1)

    SINGLE BUY +2 MDY JAN 10 130 CALL

    http://screencast.com/t/YjQwZWMwNTQ

    A 5% move up in the ETF would result in 800 plus dollar profit minus theta burn. One consideration is that the bid/ask spreads are tighter for MDY than they are for MWJ.

    or (2)

    SINGLE BUY +1 MWJ JAN 10 95 CALL

    http://screencast.com/t/YThkZTlh

    A 15% move up in the leveraged ETF would also result in an 800 plus dollar profit minus theta burn.

    Of course, I'm not comparing Red Delicious Apples to Red Delicious Apples since I'm not taking into account either potential slippage of 3x daily performance, which would be a MWJ con, or compound interest, which could be a MWJ pro if there are consecutive positive days.

    I would argue that the compounding is the only compelling reason to choose MWJ calls over MDY calls. Personally, I would consider holding MWJ calls for the duration of a swing trade.
  • therealsven
    I think one problem with analysing the market today is that it's basically broken in that so many real traders have left, and the stimuli-enriched bankers and investors are behind much of the action. That's why you see such a strong trendline since the stimulus packages were put into action, and why the market doesn't really react much to big worries, like the problems in Dubai, Greece and Spain, and the upcoming problems in the UK, the insanse bubble in the making in China and the extreme US deficit. It's all going to come crashing down, and nobody's going to see it happening until it does.
blog comments powered by Disqus

    feed

      Subscribe

    twitter

      Follow me on Twitter


    spx zero

  1. poll

    • Are you holding long term black swan insurance?


      view results

      Loading ... Loading ...

  2. recent misdeeds

    1. One Rules Them All
    2. Petit Voyage
    3. Tuesday Road Map
    4. Clash Of The Titans
    5. Defcon 2
    6. Are We There Yet?
    7. Upside Targets
    8. Socrates Nailed It
    9. What Would Socrates Do?
    10. Shut The Door Have A Seat

  3. swag outlet!

    Evil Speculator SWAG Outlet!


    search site