


March Momo Madness
March Momo Madness
I looked at equities this morning and had to pause a while in awe pondering the veracity of the recent advance in all its glory. Let’s not forget that about six weeks ago we were preparing ourselves for what seemed to be an inevitable awakening of the bear. Even though we never fully discarded the potential for a bullish reversal the odds seemed rather dim down there near the 1800 mark.

And look at this chart now – the downside insurance I grabbed about 100 handles ago is almost guaranteed to expire worthless. We are slowly making our way higher and frankly I’m not too unhappy about that as I enjoy trading alongside the old bull. However unfortunately there still appears to be trouble in paradise as some of my momo charts are stubbornly advising caution. So let’s take it off the top:

We covered SKEW on numerous occasions and if you’re unsure or completely oblivious about its meaning then I recommend the search function above or just use Google. In short it evaluates tail risk via the changes in pricing of OTM options. What I usually look for aren’t spikes but changes in spikes as I have highlighted in the chart above. Short term those spikes are useful on their own but longer term I am looking for complacency. We are seeing some of that right now but based on the current reading we could easily still churn sideways or bubble a bit higher for weeks or even months.

Here’s SKEW again but this time in ratio against the VIX. As you can see we are now heading into a region that has recently preceded downside corrections. However it’s important to highlight the fact that price needs to start showing weakness as well plus it would be helpful if we would push against some LT technical inflection point. Right now I’m not seeing too much there on the LT panels unfortunately. Perhaps the current Net-Line Buy Levels (NLBLs) near ES 2046 may be useful if we’re seeing a retest.
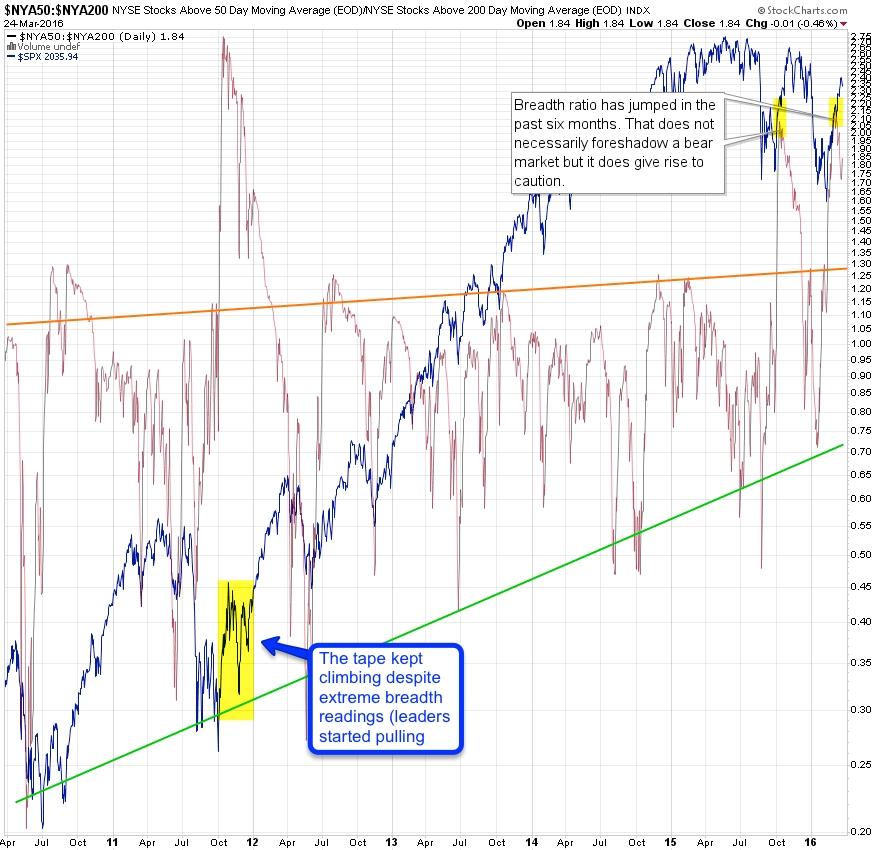
Here we’re looking at breadth and that is the first chart that really caught my attention. Most recently – before the correction to near 1800 on the ES futures – we had observed a large spike in this ratio and prepared accordingly. We’re now back at similar levels which tells us that index leaders are once again dominating (distorting) the ratio. However I should point that bad breadth doesn’t necessarily mean we’re heading into a bear market. Case in point – look at even higher readings after the lows in late 2012. It seems to me that in this case a few brave leaders started to pull the laggards. Whether or not that this is the case is debatable – I personally prefer to look only at evidence, so let’s move on to the good stuff:

It's not too late - learn how to consistently trade without worrying about the news, the clickbait, the daily drama and misinformation. If you are interested in becoming a subscriber then don't waste time and sign up here. The Zero indicator service also offers access to all Gold posts, so you actually get double the bang for your buck.
Please login or subscribe here to see the remainder of this post.


