


Pre-Market Warm Up Nov 25, 2009
Pre-Market Warm Up Nov 25, 2009
by gmak
Yesterday, the SPX bar may have been red but this was just a technicality as it fought back from the depths to close very close to flat. Given the preponderance of MSM stories of economic growth and exceeded expectations, it should come as no surprise to see a strong bid in the futures.
My favourite headline of all time is that “The FED fears there MAY BE excessive risk taking with interest rates at zero”. The FED continues to print money, the US spends, and the Bond Vigilantes are strangely silent. In their place, the Gold Vigilantes are roaring and are calling Ben’s bluff. I’m not suo sure that the CBs of the world are worried about the price of gold (some are even selling it). I think they are using it as a sign that the reflation trade is working. In the meantime, the risk trade is still on (that’s going to be 3 days in a row!).
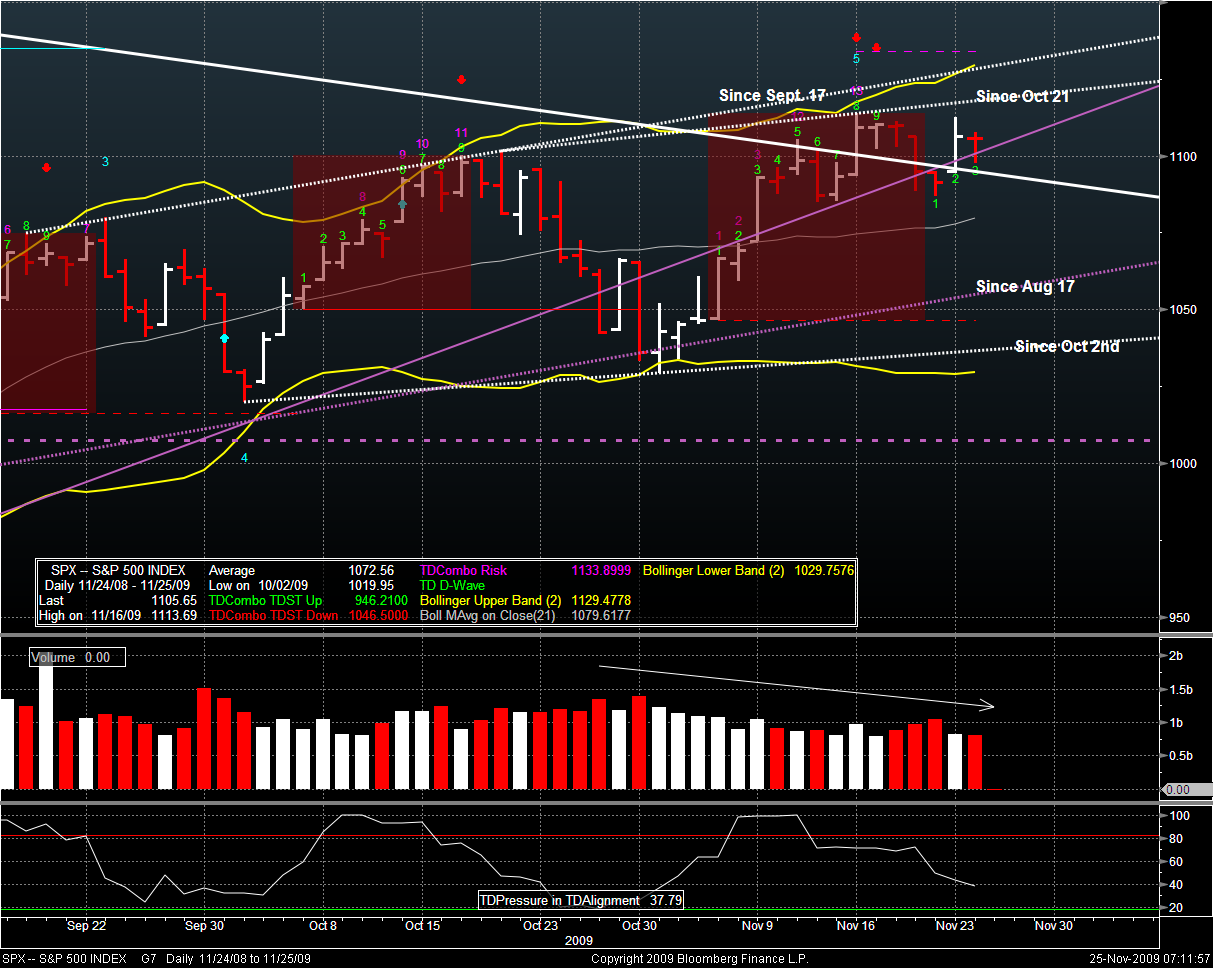
If one wishes to go long today, the “trade gone bad” level would probably be around 1100 which is the mark for the ULTRAVIOLET trend (since March 2009). What bothers me is that even though the USD is collapsing, ES is not running away. If one were to go short, the TGB level would be 1117.80 – which is the trend line since Oct 21.
SPX is still in an up trend as no lower high or lower low has yet been put in. I would consider it to be bearish if SPX could close below 1086 and open lower the next day. 1086ish is the current support level and has figured as resistance (as well) in past days.
Equity
Asia was green. Europe is green. China was up just over 2%. The DAX is up a half a percent. Here is a quick overview of global markets (NorthAm is from yesterday, natch).
The DAX is solid green in every sector – although some companies are lagging in Utilities. Well, see for yourself in the last column – the % is the proportion of companies in that sector that are up so far today.
Oddly enough, the DAX opened higher and has been stepping down with lower highs and lower lows.
What gives? ES is headed sideways and putting in a nice convenient Head & Shoulders. Bear trap anyone. In the chart below, the red dashed horizontal lines ar eTD risk levels of some importance. As you can see for yourself, they indicate floors. The green ones overhead are ceilings to the ES.
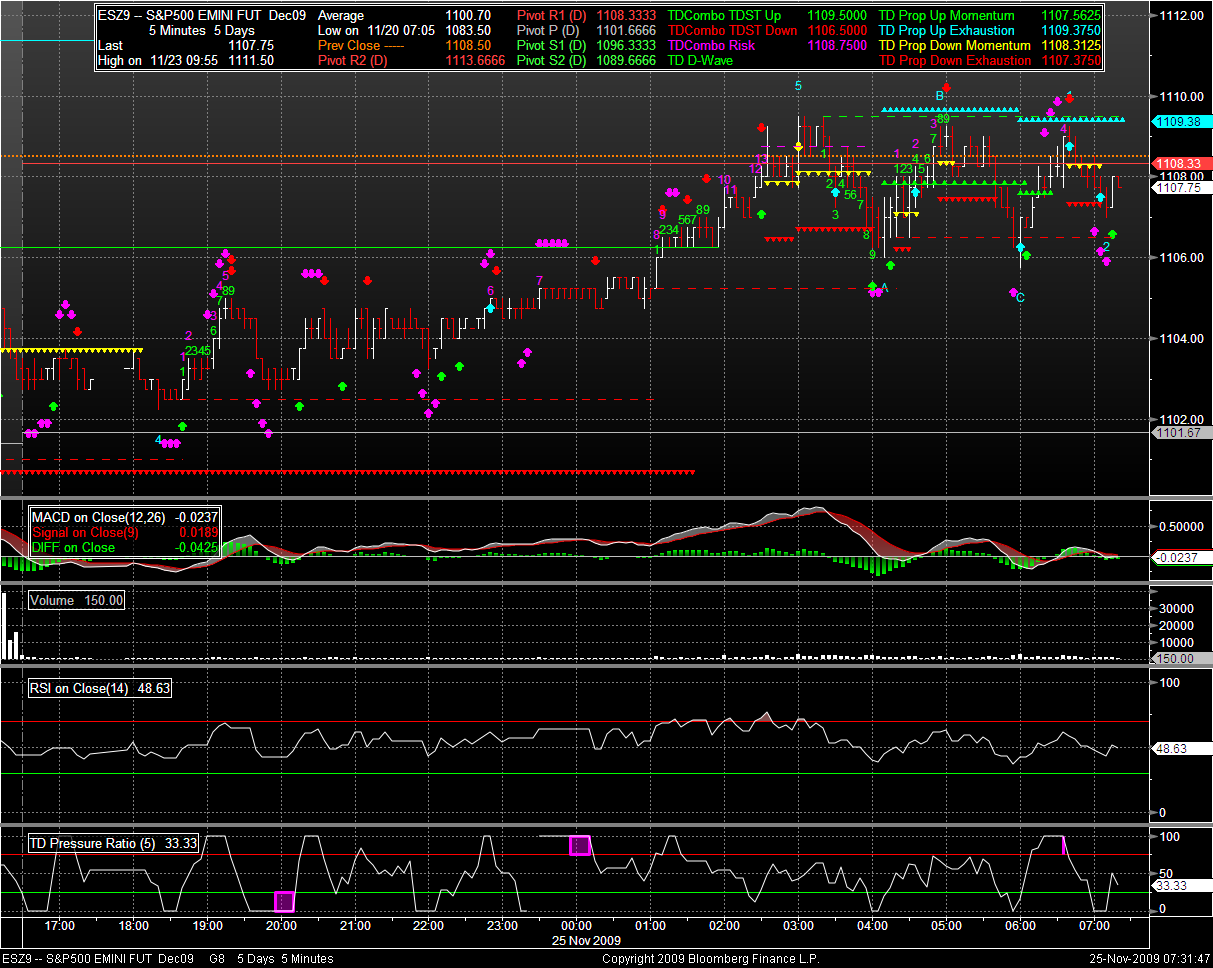
ES is experiencing a war of sorts with a triple top and a triple bottom since 1 AM EST. Pivots of note:
- R2: 1113.75 = Just above the ES high from Monday.
- R1: 1108.50 = ES’s current resistance level and ceiling.
- Neutral: 1101.75 = Quite a lot of support on multiple occasions over the last 2 weeks – even though it may break below, once ES gets back to this level it seems to stick and use it to launch higher.
- S1: 1096.50 = Very weak support if ES ever gets here.
- S2: 1089.75 = Part of the bottom of the last week or so. Definitely a line in the sand that brings in Buyers.
FX
DXY is below 74.50. CAD, JPY, EUR, and GBP are all WAY stronger (a penny + for most of them).GOLD is up but oil is not following. It’s not an inflation trade, it seems, it is a fear trade. But fear of what? The bid on the TBill auction was very good yesterday.
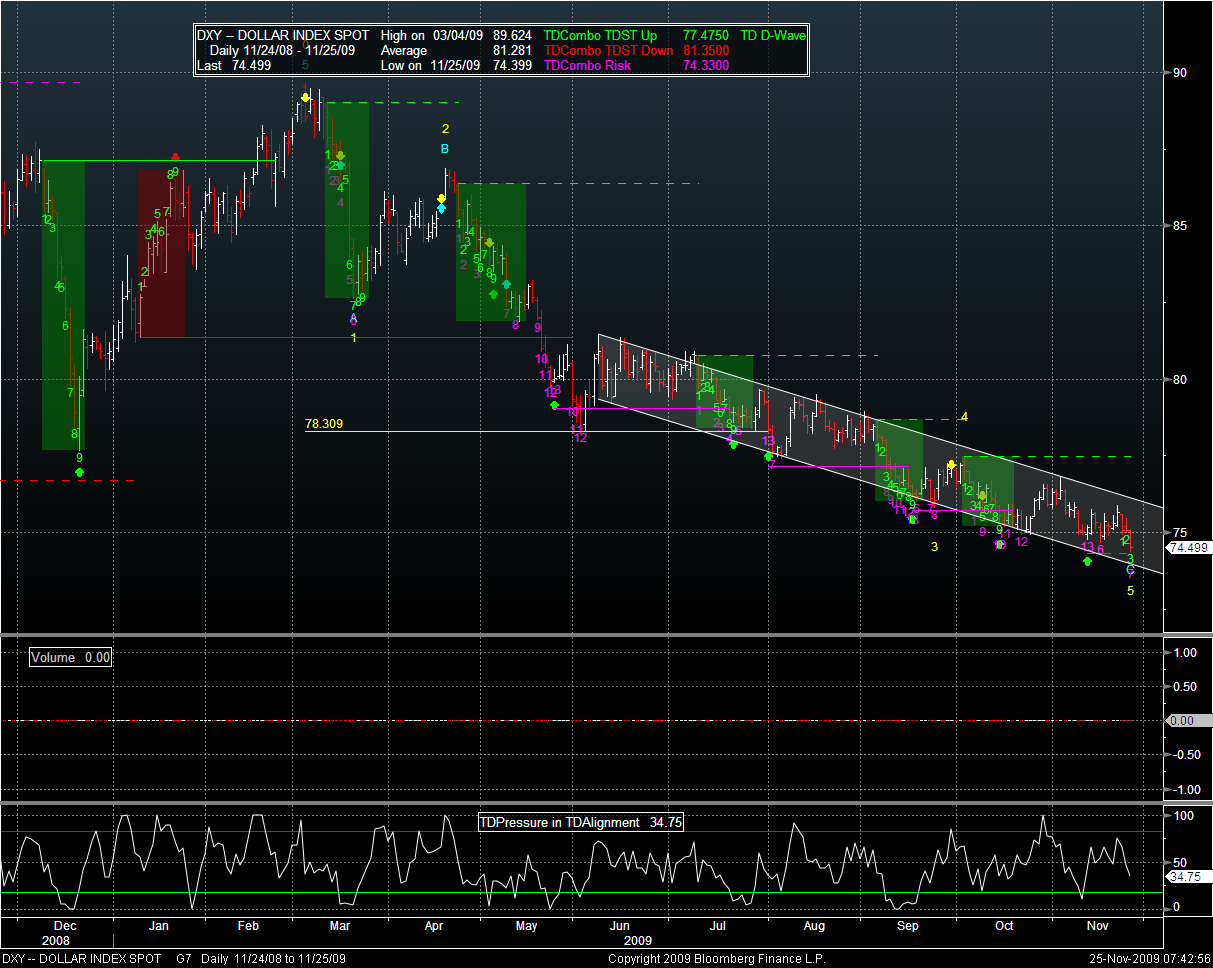
The drop in DXY certainly looks like an (inverse) parabolic shape to me. However, the daily chart looks like an orderly descending channel.
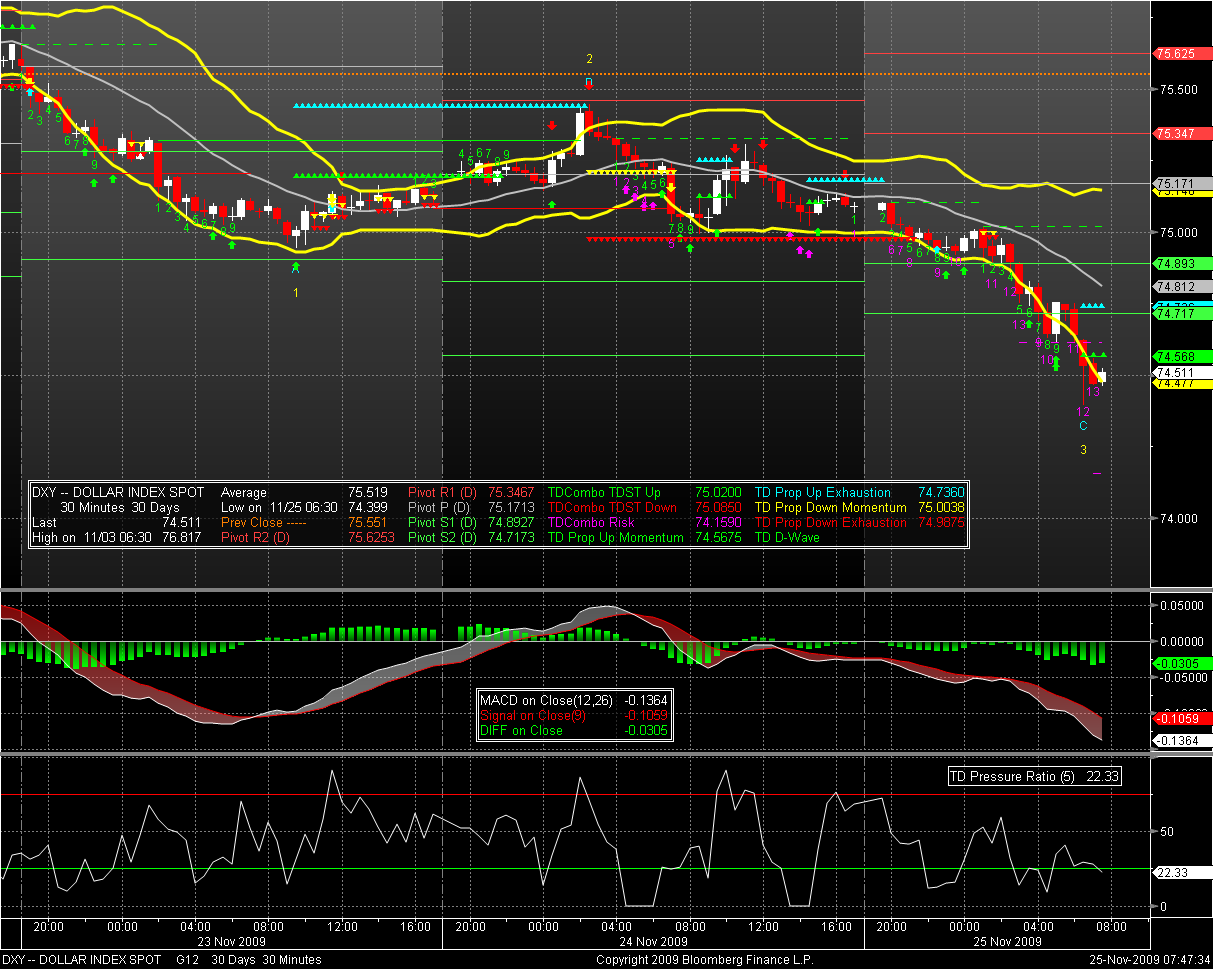
The 30 min chart, however, shows how DXY is having a harder and harder time getting off the floor after the beating. BTW, the purple number 13 near the last bar is TD’s way of saying there should be a reversal coming. TD Pressure is not supporting this view yet as it looks like it wants to head back down. MACD is starting to come back in but is till negative. AND, DXY is below all pivot support. Not a pretty picture. But, still ES has not run away. Discontinuity breeds Opportunity – if one can figure out how the correlation will come back in.
EUR is going parabolic on the 5 min chart. I don’t even need to post it. The magical 1.51 level is in sight. Remember though that the parabola goeth before the fall. I feel that I am watching a last hurrah for the EUR. IF the EUR were a stock chart, I would be looking for my entry point. After all, it has blown above the top resistance pivot as well.
Yesterday was a Tbill auctioin. Today, the USD is toast. I suspect that the FED is still active in some form of QE (if only to buy more MBS toxic waste so that the sellers can buy Tbills).
NEWS
FED Officials Say Zero Interest Rates May Be Fueling Undue Risk in Markets. (file this under no sh!t Sherlock).

DATA
Mortgage applications are down in spite of the wonderful housing data. If you really want to know how the economy is doing – watch the tax receipts at all levels.
That’s enough blathering. Be vewy vewy caiwrfuwl. Parabolas in Fx are causing disconnects and the resolution is often painful and violent.


