


Talking Junk
Talking Junk
With everyone squarely focused on equities I decided to lift the market’s skirt to get a better look at what’s happening ‘behind the scenes’, and mainly in the junk bond arena. Not a sector many people are in the habit of tracking but it is in government and corporate bonds where you usually see early rumblings of market upheaval that eventually makes its way into the stock market.
But this time things seem a bit different as what I’m seeing across the sector is a credit market getting worried about the equity market as well as the economy. Which is strange given that the U.S. economy is literally firing on all cylinders right now. So perhaps the true reason here is a growing concern that continued raising of interest rates by the Fed will manage to slow and perhaps even reverse the current economic expansion.
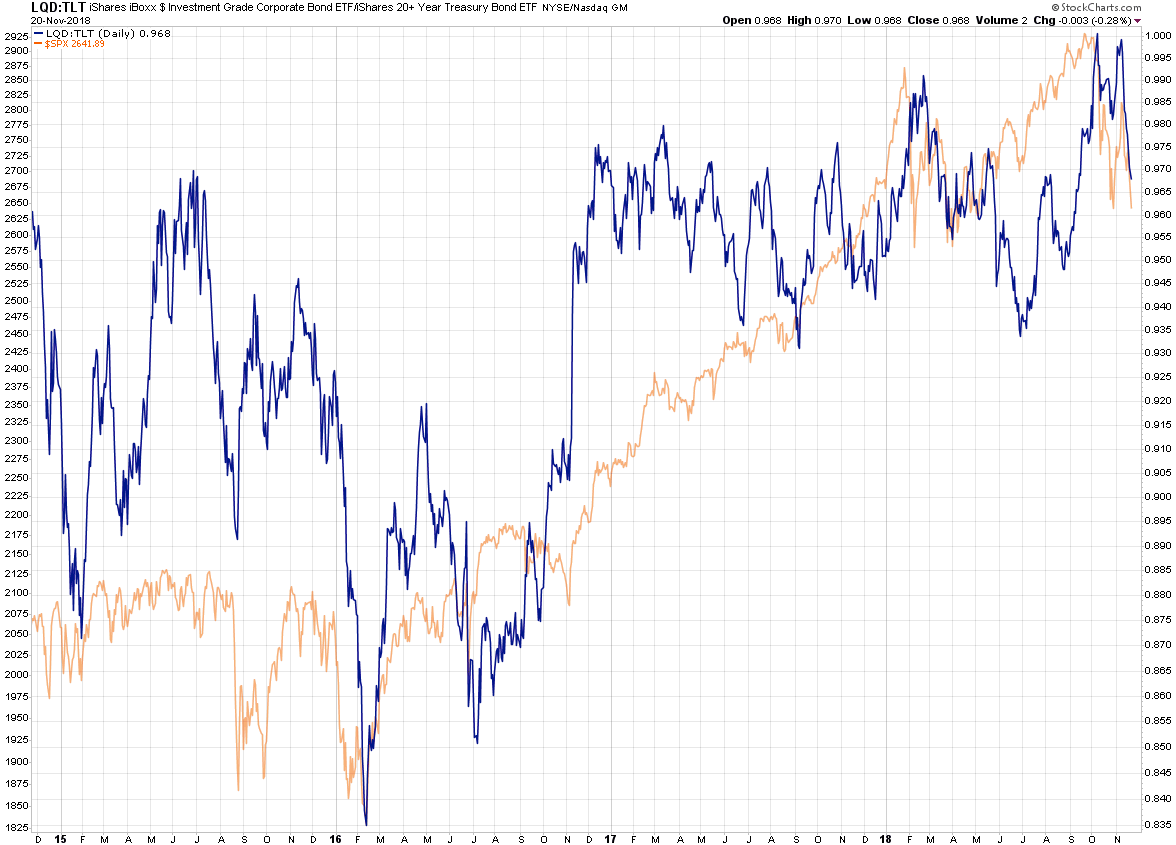
Shown above is ratio between the LQD representing investment grade corporate bonds vs. the TLT a 20 year treasure bond ETF I’m sure you are all familiar with. The LQD is run by iShares and ‘seeks to track the investment results of an index composed of U.S. dollar-denominated, investment grade corporate bonds‘.
So no junk here and it’s in fact the largest investment grade corporate bond based ETF which has been in the running for 16 years. But I wanted to post it as a baseline and to show that even higher grade corporate bonds are taking a hit right now. Note that the SPX actually turned ahead of the ratio and appears to be leading it lower. A common theme as you will discover below.
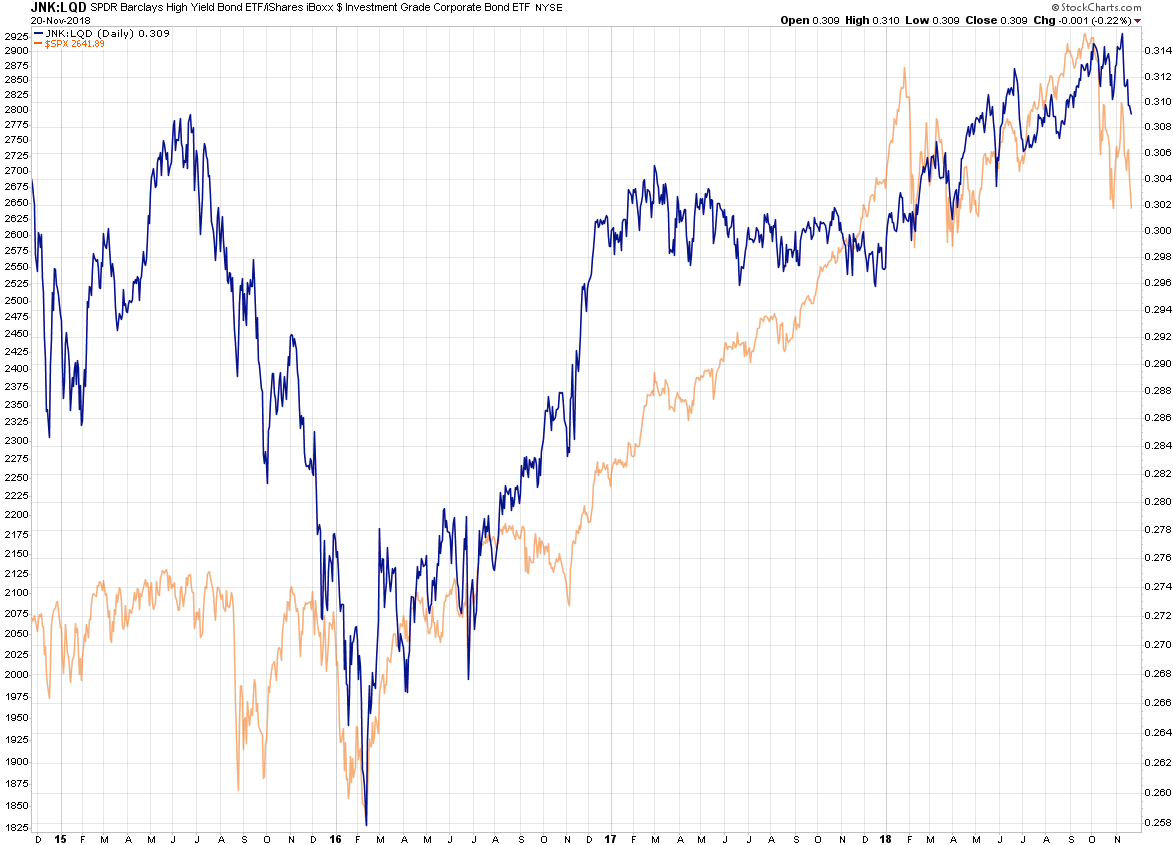
So let’s talk junk and I couldn’t have a post on junk without Barclay’s high yield bond ETF aptly named JNK. I’ve again put it in a ratio against the LQD now that we have a baseline. And once again the SPX was actually leading the ratio lower, and continues to do so which is extremely worrisome.
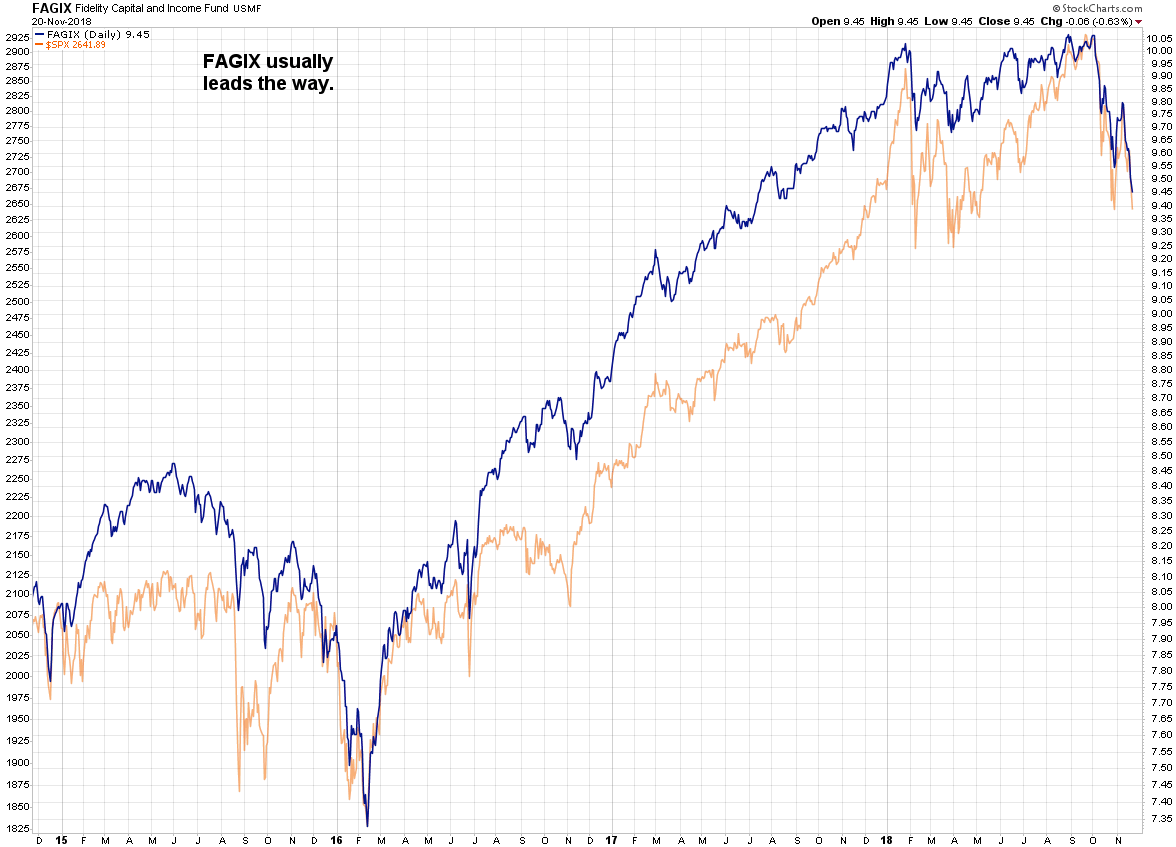
I swear, every time I look at this chart I hear Bill Burr’s voice in the back of my head: ‘What are you – a FAG?‘ Brilliant comedian but he’s gotten a bit soft over the past few years. Anyway, FAGIX is an income fund as it says in the description on the very top and ‘income’ stands for ‘high risk’, let’s not sugar it.
But it is one of the top performing funds in the high yield category. Interesting to note is that beside speculative debt rated B or lower assets it also holds about 20% of its assets in equities. Which may have had an additional impact on its performance over the past year.
So here it was, happily plotting along in the upper stratosphere adjusting its oxygen mixture and minding its own business, when it peeked down and saw the SPX dive bombing lower. WT…?
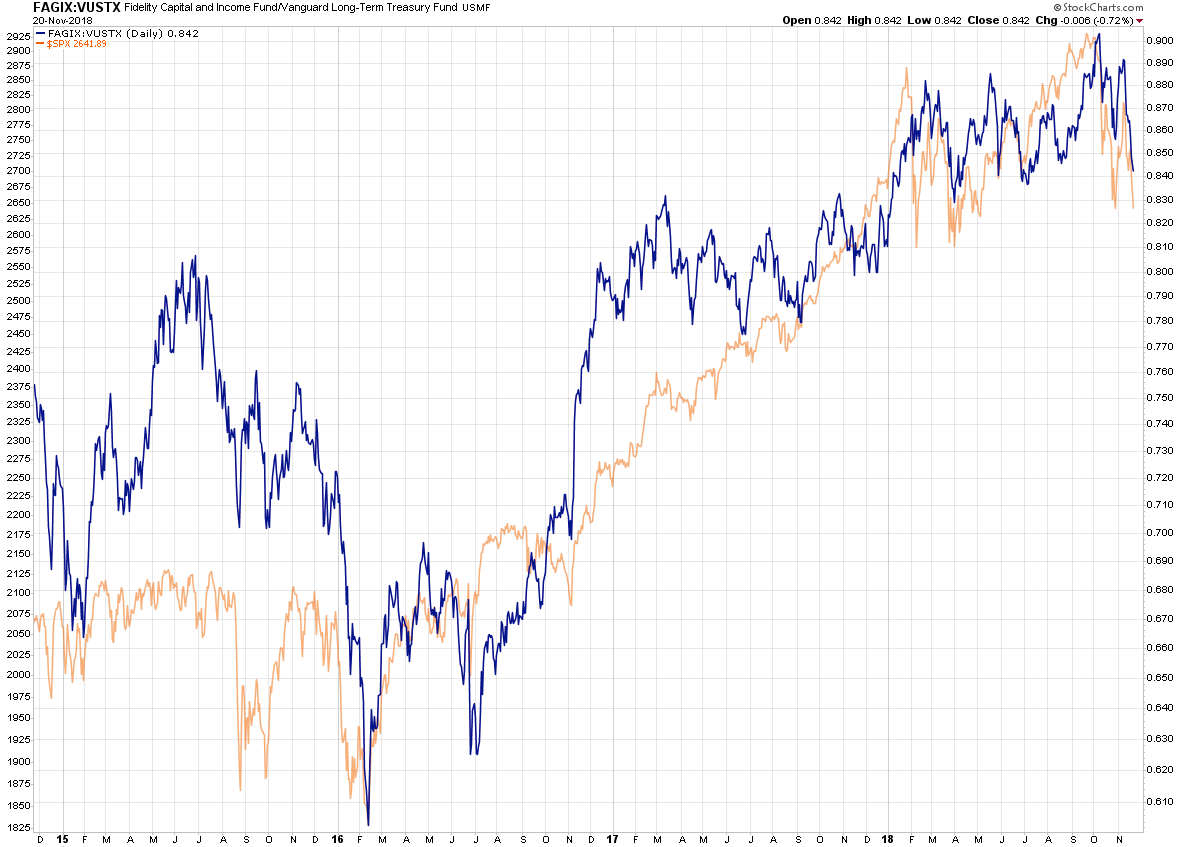
Okay now we’re getting fancy as I’ve put Bill’s favorite fund in a ratio with VUSTX which is a treasury fund issued by Vanguard. Basically VUSTX invests in debt issued directly by the government in the form of long-term treasuries, so it is a stand-in for TLT, but with an average duration of 15 years. Therefore it’s more susceptible to changes in interest rates and plotted against on its own it’s been taking a hit since the summer of 2016. Reason being of course rising interest rates and a more hawkish Fed (which means higher yields).
Anyway, back to the ratio shown above. It’s also following equities lower but once again it seems to be the one that’s lagging. Which appears to be the case across the entire sector apparently.
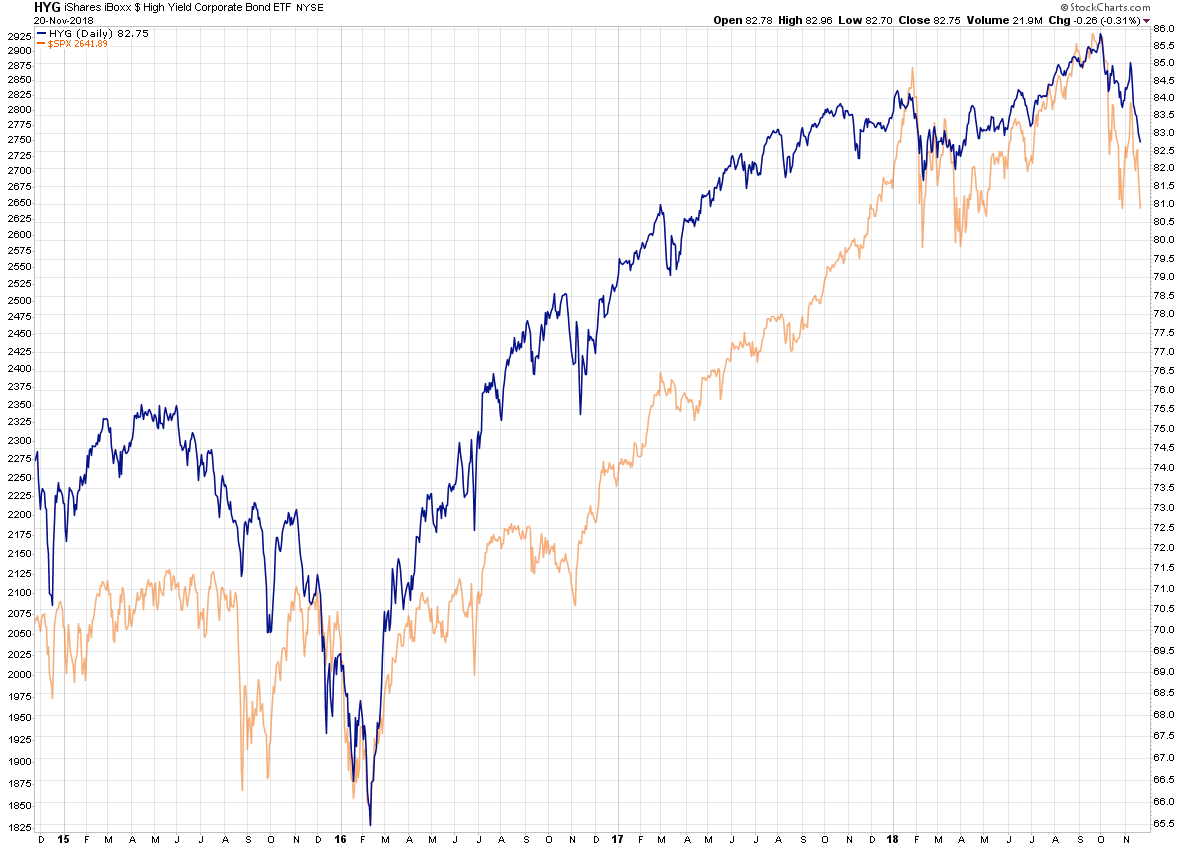
One more for the road: HYG which like LQD is also issued by iShares and is one of the most widely used high yield bond ETFs. Its investment object is to track the investment results of an index composed of U.S. dollar-denominated, high yield corporate bonds. So yeah, we’re talking pretty junkie, and also lagging the SPX apparently.
What The Deuce?
I’m the first one to admit that I’m not a bond and especially junk bond market specialist and what I am able to offer here are simply general technical observations regarding the sector as a whole. Seems to me that bond holders especially on the corporate side were caught a bit by surprise here and are adjusting their exposure along with each swing in equities. So if you’re looking for clues in the credit sector right now about what may be in store for the equity market then you will be squarely disappointed (and possibly poorer for it).
That said, the charts shown above clearly show that there is accumulating fear about what’s in store for the stock market in 2019 and beyond (another clue is the continually elevated VIN/VIF ratio I keep sharing here). It’s still subtle and has not exceeded the correction we endured earlier this year. But one must wonder what will happen if the economy eventually hits a snag. Not even Trump can deliver 3%+ growth every single quarter and it seems to me that market participants are literally looking for an excuse to dump assets across the board.

That’s it for this week. Wishing you all a very happy Thanksgiving! I see you next Monday bright eyed and bushy tailed (and possibly a pound or two heavier).


