


April Momo Update
April Momo Update
Today is going to be a big day for equities. As it’s the last session of the month, the candle we paint today will be on record and add another piece to the puzzle that we have slowly been putting together over the past few months. But let’s backtrack for a moment and pick this one up later. This morning I came across a brief interview with Art Cashin which gave me much pause. Disclaimer: I usually don’t watch MSNBC or any financial news but had followed a pertinent link in my online UBS account out of sheer curiosity. So Bob Pisani kind of throws this softball at Art saying that nothing really seems to be able to break or slow down this market. And I was actually a bit surprised when Art didn’t really stomp on it right away.
Now at the danger of ruffling feathers – I have the utmost respect for Mr. Cashin. The man was alrady working on Wall Street when I wasn’t even sperm yet. He probably has forgotten more about market cycles than I will ever know. That said – I am extremely suspicious about unidirectional markets. I also believe that we have come way too far in a way too short amount of time.
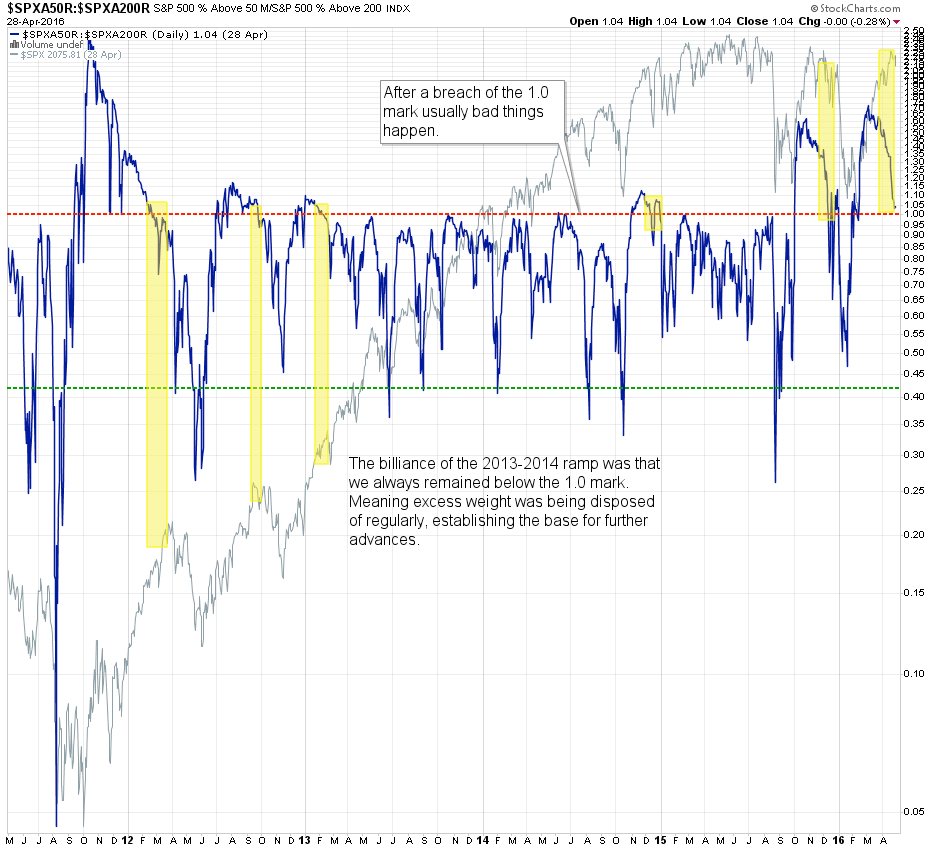
Take a look at the chart I posted above which depicts breadth on the SPX over the past half decade. In particular take note of the 1.0 mark which I have delineated in order to make a very important point. What really signified the height of the recent bull market, and by that I am referring to roughly 2013 all the way into late 2014, is that it knew when to permit a healthy shake out. The 1.0 mark was never breached and thus any weakness led to only small corrections.
Now contrast that with earlier years when the wall of worry still produced more overall volatility. Drawn-out buying frenzies were met with deep corrections, which led to smaller iterations of the same, eventually slowing into the steady step and go we see throughout the center of this chart. Since late 2014 however we are now seeing the exact inverse. Sell-offs are becoming deeper and are preceded by extensive sideways topping patterns. Which are accompanied by signal divergences on the breadth ratio (i.e. stocks above their 50SMA vs those above their 200 SMA).
Which market do you believe is healthier and has more growth potential? I think most would agree that it is the one in the center. So when someone tells me that there is ‘no stopping this market’ then I am reminded of Joe Kennedy’s quote: “You know it’s time to sell when shoeshine boys give you stock tips.”

Now here’s a similar view but this time on the NYSE, just to show you that this is not just isolated to the S&P 500. If nothing else those huge divergences should give anyone pause in holding long here – sure we could be riding higher for another 100 S&P handles but the time to be long was near 1800 until about the 2k mark – at this point it’s time to look for an exit.
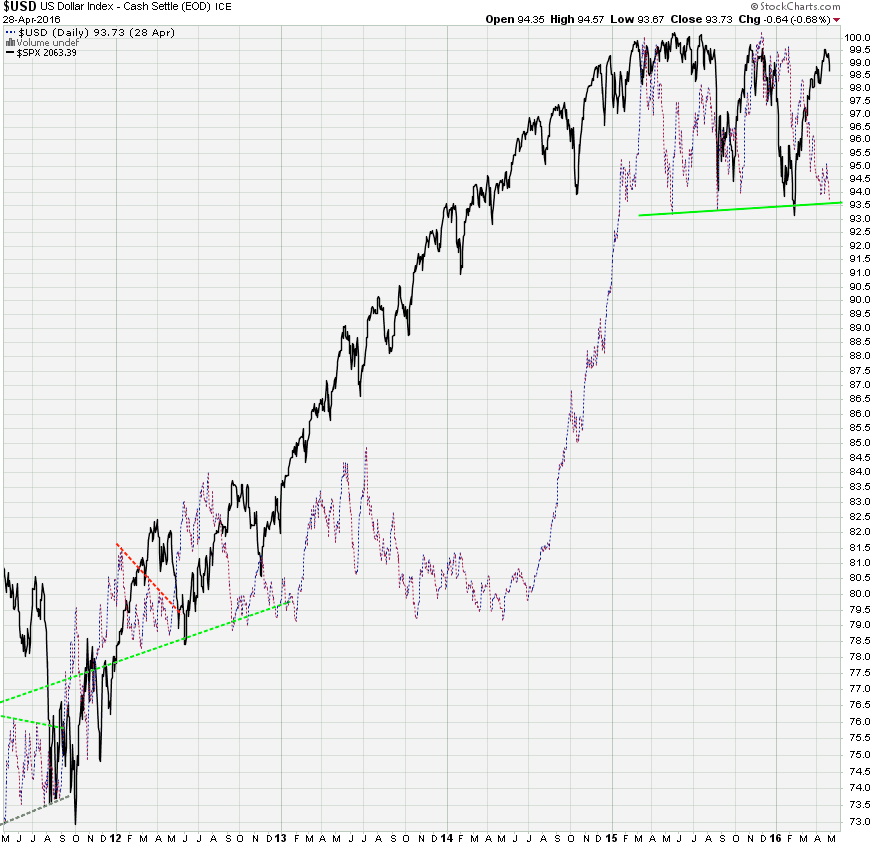
And then of course there’s this. A large contributing aspect of the current effervescence in equities has been a falling Dollar, greatly aided by a wishy-washy Fed lead by Yellen who has been tip toeing around the obvious fact that she’s really unable to raise rates without crashing the market. And once again it’s quite possible that the Dollar falls through long term support here. But what if it does – will it go to 90 or lower? Draghi on my side of the Atlantic has his own issues and could drop a nasty surprise any day if the EUR starts appreciating beyond the ECB’s comfort zone. Given the breadth and momentum readings I have been reporting here for the past few months I wouldn’t want to be anywhere near equities when but if that day happens.
A lot more below the fold for our intrepid subscribers:

It's not too late - learn how to consistently trade without worrying about the news, the clickbait, the daily drama and misinformation. If you are interested in becoming a subscriber then don't waste time and sign up here. The Zero indicator service also offers access to all Gold posts, so you actually get double the bang for your buck.
Please login or subscribe here to see the remainder of this post.


