


End Of Summer MOMO Update
End Of Summer MOMO Update
Labor Day is behind us which pretty much marks the end of the summer season and, fortunately for us, the time when many traders and investors return from hibernation. Even here at the evil lair I’m seeing a distinct uptick in new subscriptions after Labor Day and fortunately many of them happen to be familiar faces. Welcome back!
If you haven’t been here for a few months then you may be happy to learn that the Mole has been working his butt off all summer and will be introducing new exciting additions to Evil Speculator over the coming weeks and months. But now, as promised yesterday, it is again time to take another gander at the market momo and volatility front.
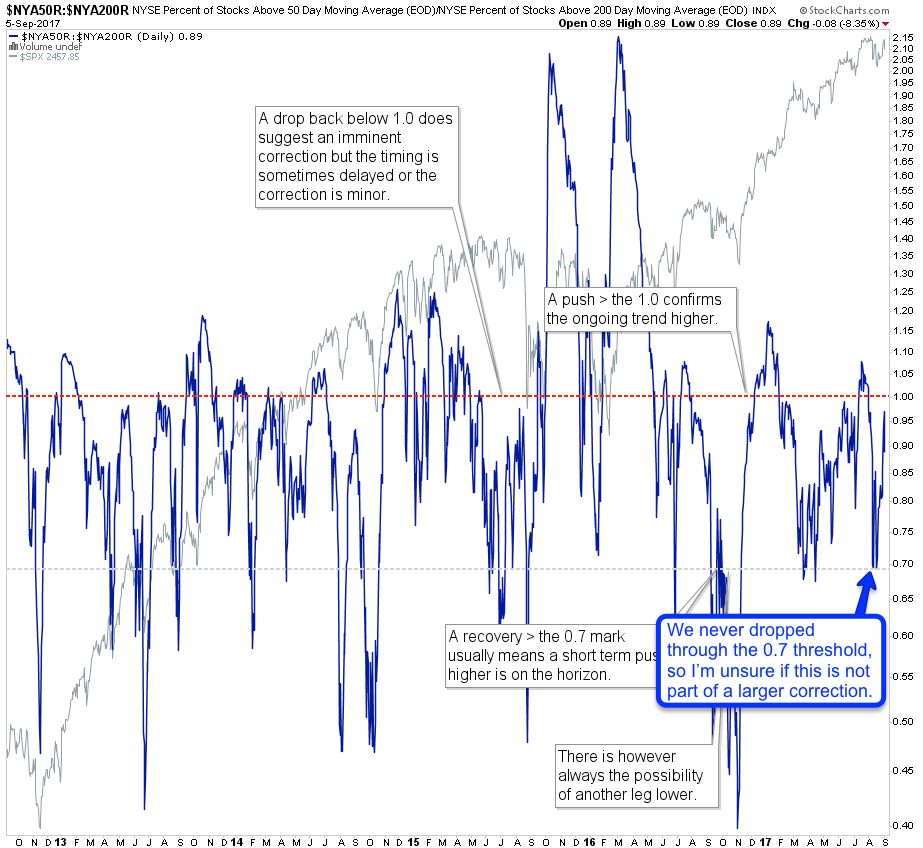
Let’s kick things off with market breadth expressed here by the ratio between NYSE stocks trading > their 50 SMA vs the ones trading > their 200 SMA. I’m sure you’re getting the general idea here which revolves around the underlying health of a market. Are indices mainly advancing courtesy of a small number of strong leaders or does the entire market exhibit strength (or weakness)?
As you can see the signal gyrates around quite a bit and it actually took me a while to figure out the proper thresholds which seemed to have meaning. What I settled on in the end were the 1.0 and 0.7 threshold – the rules are explained on the chart so I won’t be regurgitating them again.
What’s a bit puzzling to me right now is that the signal did actually not drop below the 0.7 threshold during last month’s lows. Which means that we didn’t get a true buy signal here on the recovery higher and that in turn leaves a small chance that we are still actually in a larger long term correction. The only thing that disqualifies that scenario would be a) a push to new all time highs or b) a push > the 1.0 threshold on the chart above.
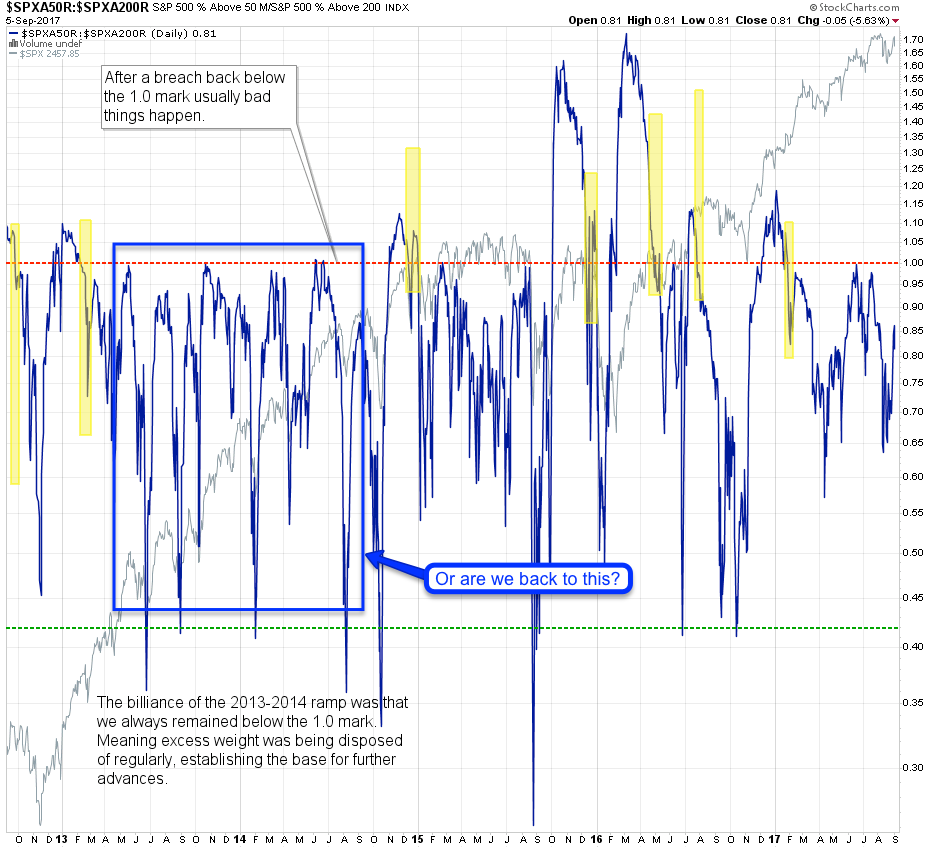
The SPXA50:SPXA200 ratio is obviously related to the previous chart but only factors in S&P 500 stocks. Frankly this is the most bearish momo chart I came across and as it’s not confirmed by any others just yet I’m going to withhold judgment. However should the SPX experience renewed weakness then this is may be a chart to watch, especially if the signal drops through the 0.65 mark again, which could lead us lower. But for now I’m taking it with a few grains of salt.
There’s another aspect to the current formation. Some of you may remember this chart from before and I have often used it as a handy prop when trying to show how ruthlessly efficient the relentless bull market between 2013 and 2014 advanced higher without ever triggering the upper threshold. So this bodes the question as to whether we may be inside yet another effervescent phase of this never ending generational bull market. Hey, if the bulls make it to 15 years then it’s officially one generation if I’m not mistaken.

The CPCE is issued by the CBOE and refers to the ratio of put and call options in their exchange. The way I’m using it is a bit unorthodox but it has worked pretty well for us over the years, especially when it comes to long reversals. Once again I’ve got a bit of a head scratcher here as it recently pushed > the upper 1.0 (bearish) threshold (by a mere hair) and then dropped back down immediately. I guess technically speaking that is a bearish reversal signal but let’s keep in mind that even the real confirmed ones have not worked that well in recent history.
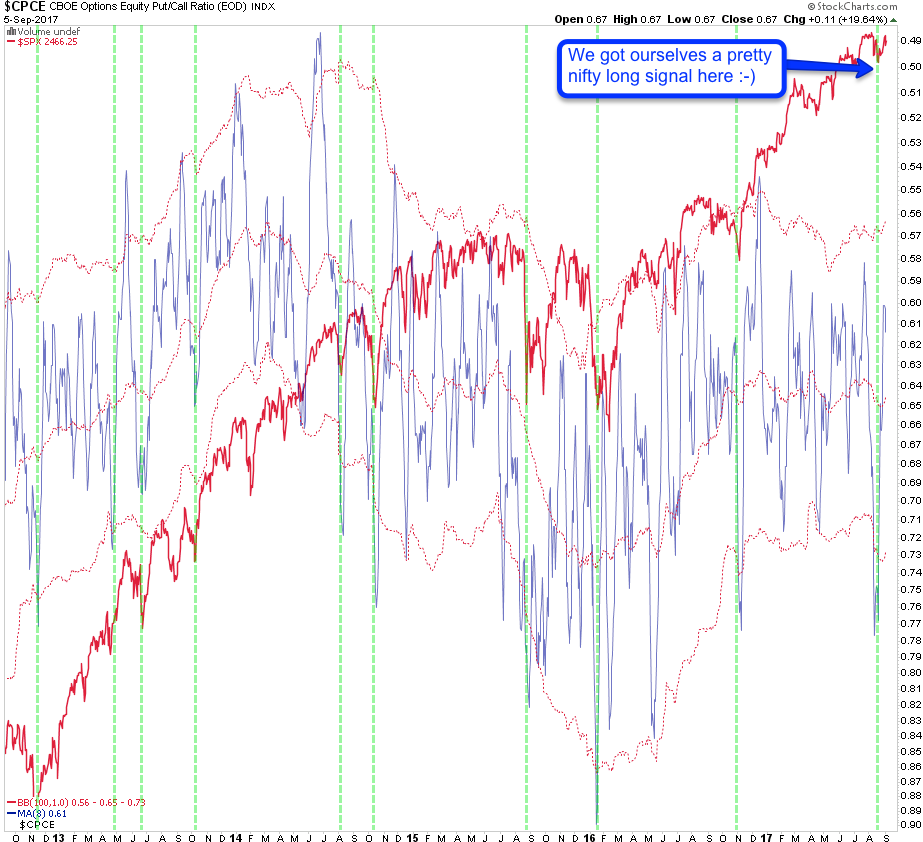
On the long side however we seem to have ourselves a pretty nifty long signal here. That push > the lower Bollinger was the right moment to be long. Which of course is what we did if you recall.
Well, I’d love to give it all away but those servers and lap dances don’t pay for themselves. If you’re not a member then sign up right now as you definitely don’t want to miss out on my volatility charts!

It's not too late - learn how to consistently trade without worrying about the news, the clickbait, the daily drama and misinformation. If you are interested in becoming a subscriber then don't waste time and sign up here. The Zero indicator service also offers access to all Gold posts, so you actually get double the bang for your buck.
Please login or subscribe here to see the remainder of this post.


