Top And Bottom Performing Stocks For Week #49
Top And Bottom Performing Stocks For Week #49
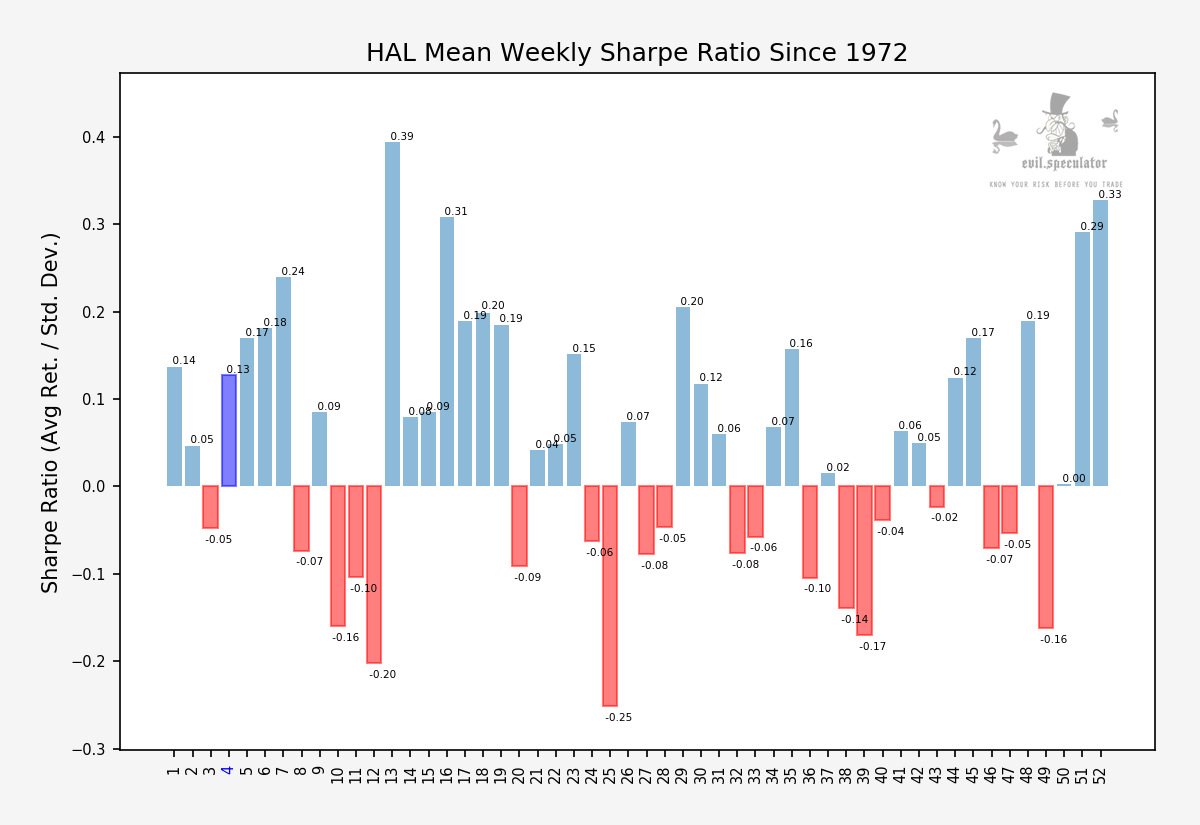
It is Sunday afternoon and that means we get to review the performance of last week’s historical top and bottom stock symbols in the S&P 500. As you may recall these symbols are the result of parsing a database containing over 50 years worth of statistical performance data. The idea is to extract the prospective top ten winners and losers of the coming week purely based on historical statistics. The result is then sorted by liquidity and any symbol that is scheduled to report earnings or pass ex-dividend is being excluded.
How To Trade Along
Although being no guarantor of success, the long and short candidates posted here each week are intended to perform along their respective historical bias. One way of trading along would be to simply create a small one-week portfolio by buying the long candidates and selling the short candidates on Monday morning shortly after the open. There are no official stops or targets and all transactions are reversed Friday afternoon right before the bell.
For anyone who wants to keep track I have created a new WP category that allows you to pull all pertinent posts up to date. Eventually I’ll be putting together a summary spreadsheet once we have accumulated sufficient stats.
Results For Week # 48
Another week and another penny in the piggy. Although the shorts clearly under performed the longs pulled way ahead and netted us a respectable total profit of 14.3 relative percent, which means the return of the overall portfolio of 20 stocks is 1/20 of that, or 0.75%. Yes, I know that doesn’t sound like much but it sure adds up on a weekly basis. I should call it the Chinese water drip torture system
Long Profits: GE=-1.7, AAPL=-2.24, WFC=3.9, CSCO=3.04, T=4.85, RF=6.94, JCP=3.07, JPM=6.58, CLF=3.18, X=0.31
Long Profits Total: 27.93
Short Profits: BSX=8.76, D=-1.65, UGI=-2.47, RGEN=-2.78, RLI=0.44, AXGN=-1.34, OBCI=-0.24, YUMA=-13.91, CRT=0.78, MLAB=-1.22
Short Profits Total: -13.63
Combined Profits Total: 14.3