


Living Inside a Broken Clock: Friday, Dec. 18, 2009.
Living Inside a Broken Clock: Friday, Dec. 18, 2009.
by gmak
Banks are walking away from their own real estate, all the while they quote the moral higher ground to homeowners deep under water. Bernanke is re-confirmed because there really isn’t anyone better to do the job!? The shrinking US Trade Deficit, while good for the USD, means that there are fewer FRNs out in the world with which to buy Treasuries. Tick. Tock. Tick. Tock.
EQUITY
The world was red, and for some reason Europe decided it should be green. German business confidence rose to the highest leel in 17 months in December – even as the European current account stayed in deficit (current account includes the trade account) at -4.6 bb vs -2.3 bb expected. PPI was subdued at 0.1% MoM for Germany. Oddly enough Consumer Staples and Financials are shunned today in the DAX. But still the DAX is keeping close to that target of 5900.
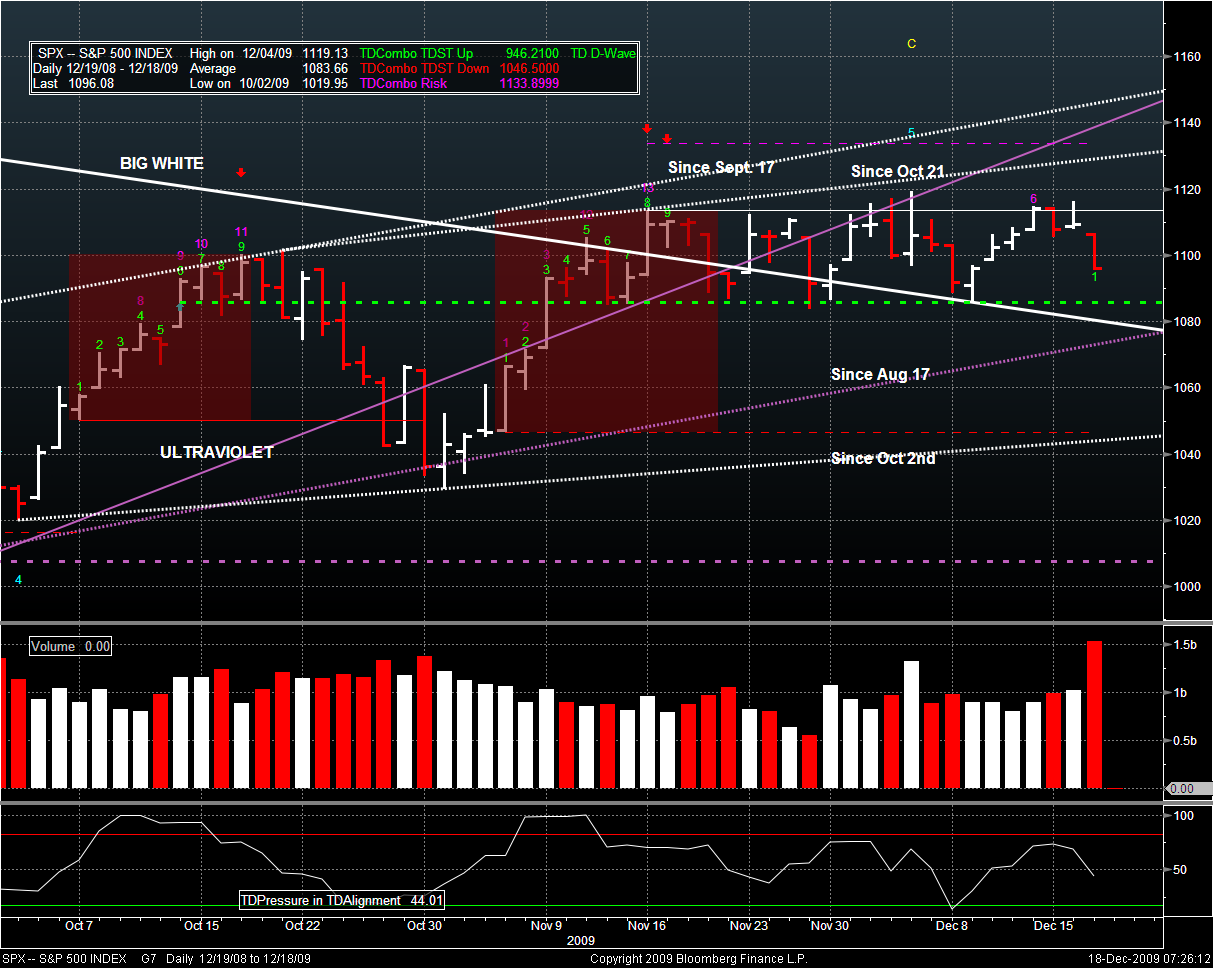
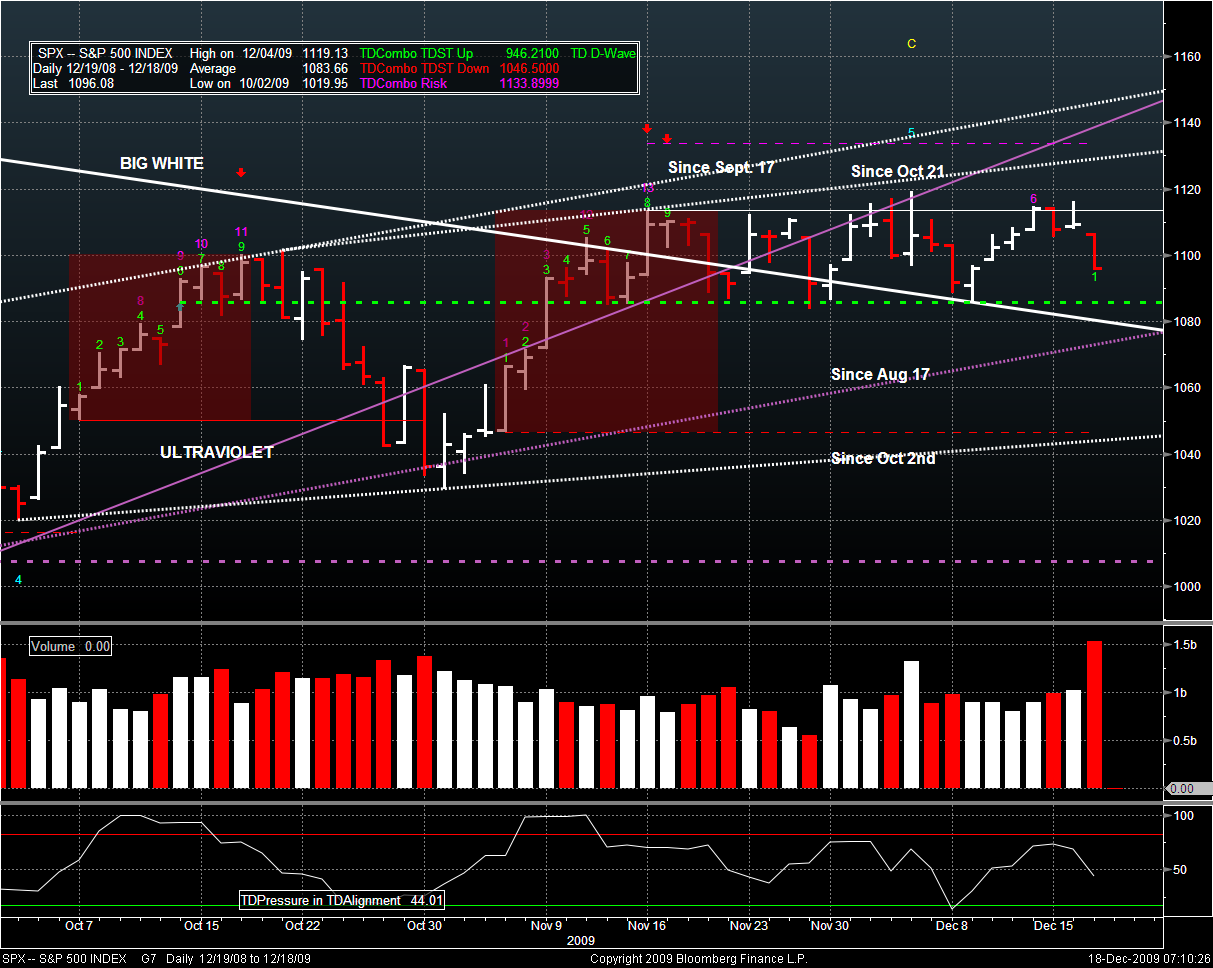
SPX closed the gap from Dec 10th, yesterday, and didn’t bounce into the close. Today is OPEX and the behaviour will not make sense (well, more so than all the other days of the market). I would suggest strength in the early going, on OPEX and Europe, followed by fading into the close as traders square positions for the weekend and the shortened trading week coming up.
At some point SPX will reach 1086, again. There are no guarantees. It could bounce from there yet one more time, in a shorter echo loop. It could fall through to test the trend line “Since Aug 17” or even “Since Oct 2nd”, or even the last low a t SPX = 1029.38. There are lots of levels for dip buyers to justify coming in, lots of levels screening stops, lots of levels to be broken. TD thinks that the most important level on the daily chart is that RED dashed line just above the “Since Oct 2nd” trend line. Going through that early in a setup count (1 to 9 consecutive bars) usually means more downside. Going through late in a setup count usually means a reversal coming.
ES has been climbing with a megaphone like pattern = widening channel, since the lock up. ES has run into lots of TD resistance at around 1102 (see all the dashed lines?) and pushed back down. Notice that ES is passing over the red dashed line at around 1092 early in the setup count (green numbers 1 and 2). This usually means more downside – but first the pivot at 1097 needs to be broken.
- R2: 1113 = Not very likely today without a bullish miracle
- R1: 1103.75 = just out of reach. Lots of sellers coming in around 1102 – and TD is hi-lighting tecnical resistance here.
- Neutral: 1097 = current support that would probably be broken if this were regular trading hours – but can push ES around due to the quite low volumes even for this time.
- S1: 1088 = Below where ES has been for the last 2 weeks
- S2: 1081.50 = Equivalent to SPX = 1086 and the dashed green line on the SPX daily chart. A point of reckoning. Abandon hope all ye who enter here. etc.
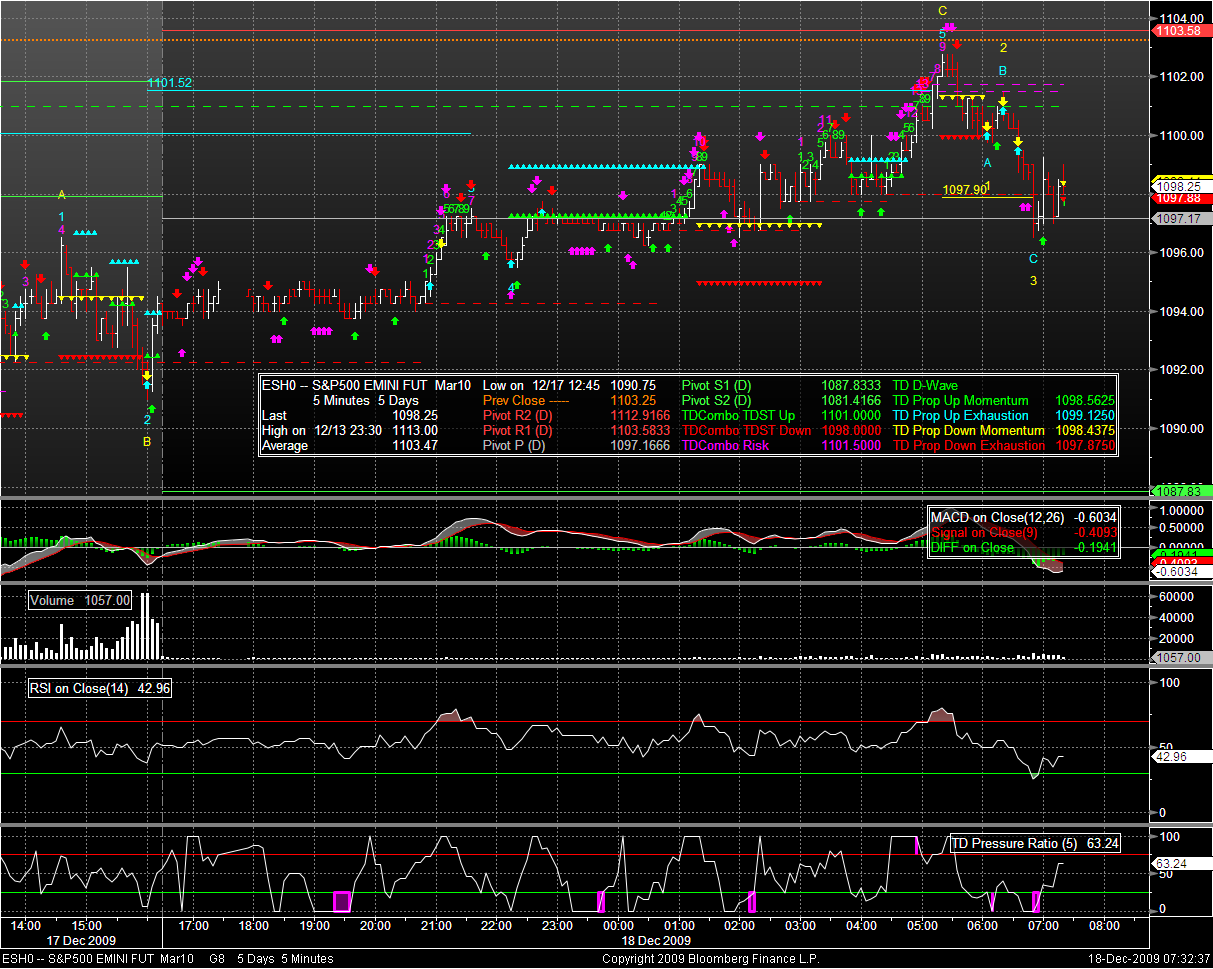
I don’t trade OPEX because it is too Alice through the Looking Glass for me. (Now that’s another good title for a post = Through the Looking Glass). However, I will say that a long scalp here at ES = 1097.50ish with stop below the low at 1096.50 on ESH0 seems like a good risk/reward with a target around 1101 – 1102.
FX
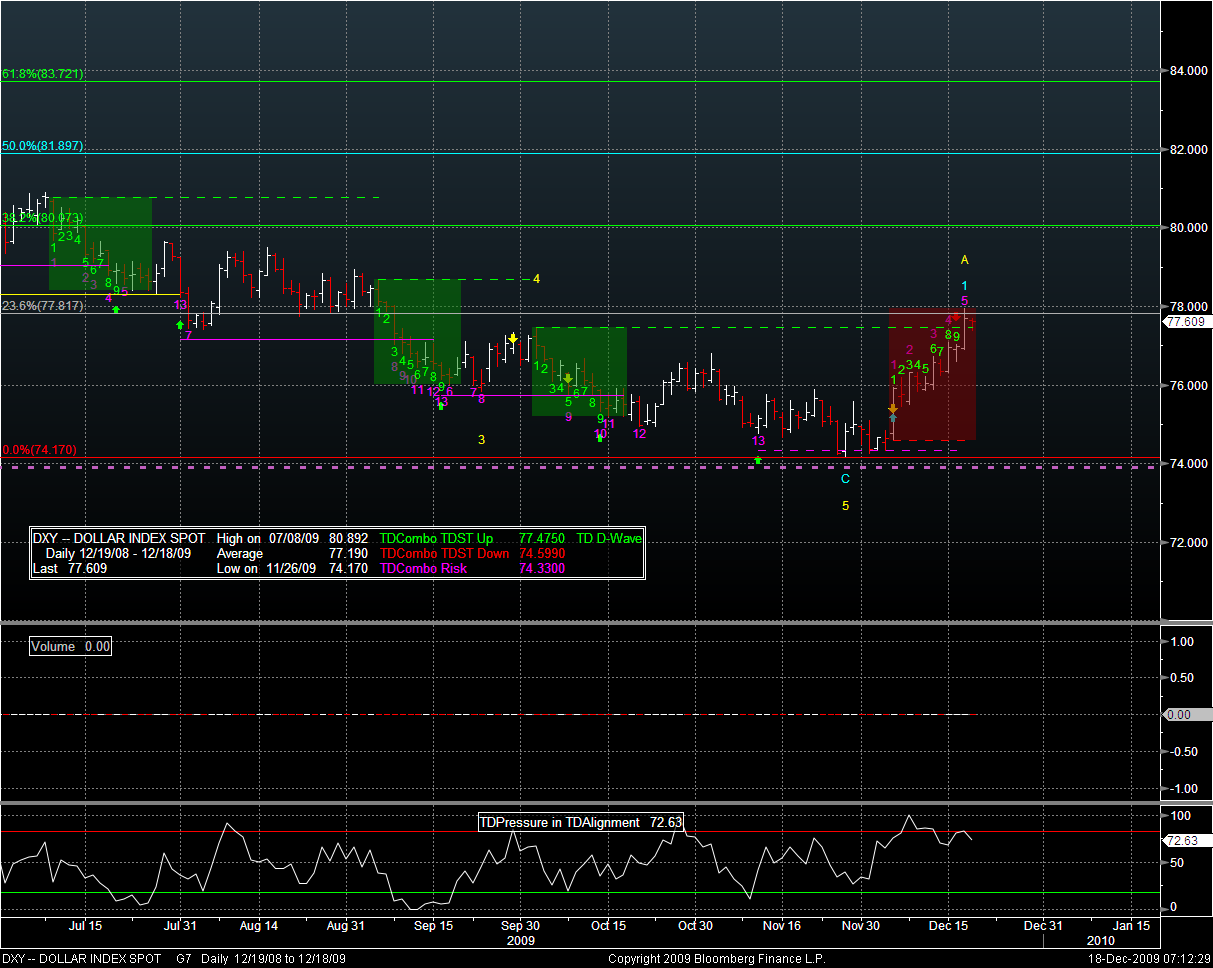
The USD teeter-totter is down today. But, the daily chart shows that an important level has been reached and some consolidation is in order. Notice that DXY is fighting over the 23.6% FIB from the most recent high and low. The dashed green line says that DXY is likely to retrace since the setup count got there at too high a number. Plus, TD Pressure at the bottom of the charts shows that it is coming down from overbought. Wave A of ABC (down sequence) could be in. Wave B needs to be down. What else can I say? Just that the usual DXY / SPX correlations may not hold – they have been spotty lately so don’t bet the house on this. All the TD green dashed lines show important levels to be breached to ensure that the upward trend continues. I’ve also drawn the FIBS.
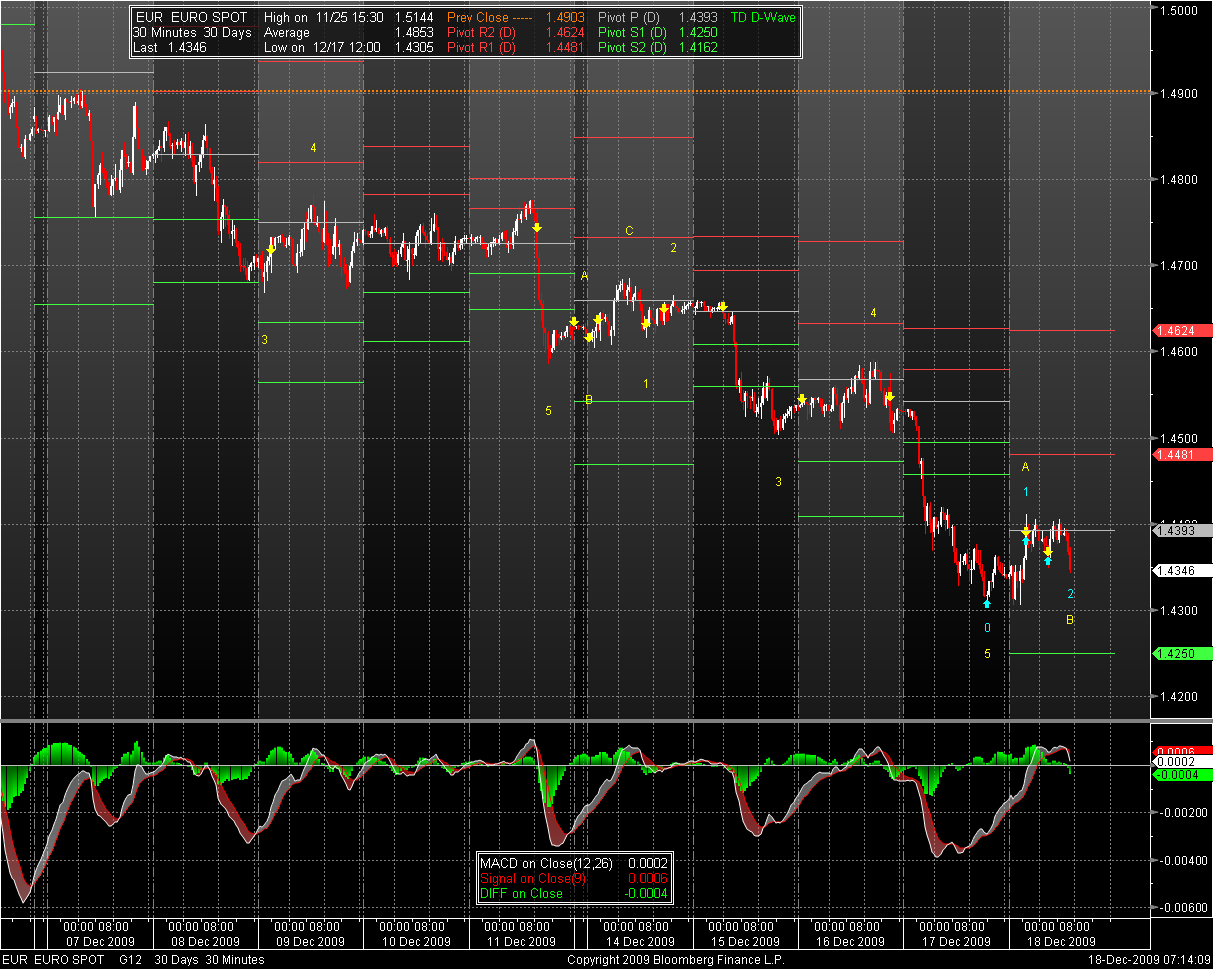
The EUR tried to move off its recent bottom but has run into strong resistance at the neutral pivot at 1.4393. Nice little “M” pattern forming on the 30 min chart. Local Low was 1.4307, and it seems to have held a number of times since yesterday noon. It might be a good level for a long scalp on a bounce, or an indicator to go short EUR if breached decisively.
NEWS
DATA

FED B/S expanded by $50 bb but the reserves of Banks with the Reserve also decrased by $30 bb giving a net boost of $80 bb to the financial system. It must have been used to buy the short-term Tbills offered because the other markets sure didn’t puff up. I can’t emphasize enough the significance of the declining USD Trade Defiict and how it foreshadows rising interest rates in the US.
Cheers.


