


Living Inside a Broken Clock: Wednesday, Dec. 30, 2009
Living Inside a Broken Clock: Wednesday, Dec. 30, 2009
by gmak
Household ownership of equities as a percentage of total assets is falling, even with the drop in housing prices. However, it is not yet at the cyclical low. Either all other assets will go up in price (notice that I don’t say value), or equities will fall in price. At the same time, bond ownership as a percentage of total assets is at a cyclical high – with rates at their generational lowest. If interest rates rise, then housing prices and bond prices will fall, which means that equity prices could fall even more- IF the %equity cycle is going to play out as in previous generations. You can see all sorts of other sectors analysed as well here:
http://www.contraryinvestor.com/mo.htm
Here is an historic data set of certain asset ownership back to 1952 if you like to crunch your own numbers.
http://www.census.gov/compendia/statab/2010/tables/10s1164.xls
Where is all the money coming from to support the price growth in assets? Every dollar of cash ($929 billion = http://www.federalreserve.gov/releases/h41/Current/ ) is supporting 57 dollars of debt or credit. ( $53,000 billion = http://www.federalreserve.gov/releases/z1/Current/z1r-4.pdf – see Line 1 “Total Credit Market Debt owed by”). That is substantial leverage and suggests why the USD is so weak. The point is that the debt is in fact dollar creation and the reason that prices have been rising over the last century or so. Here is a better analysis than I have time for.
http://jengafinance.blogspot.com/2009/12/fractional-naked-shorting.html
Meanwhile, the amount of debt is contracting. Market Ticker has a nicely compiled chart of all the data in one place. The number of data points of contraction is relatively small – but there nonetheless.
http://market-ticker.org/uploads/Z1-2009-12/debt-1980-on.png
In spite of massive B/S expansion by the FED – which should lead to total money expansion (cash and debt) – debt has leveled off or is falling. The math is fairly simple:
Individual Asset Prices = total money (includes cash and debt) divided by total assets.
If all this money (and debt) shrinks, then some or all of the asset prices need to fall as well. (if you have 200 shells and 100 coconuts, then each coconut is priced at two shells. If 100 shells are “destroyed” then each coconut is priced at 1 shell. The value of the coconut has not changed, but its price has. Here is an old primer written on this topic several years ago: http://www.bullnotbull.com/archive/graham-1.html )
If the %equity cycle is valid, then equities are where the price adjustment should happen. Yet it appears that major IBs are still expecting households to up their ownership in equities. (From the first link: “we’ve seen research from some of the highest bonus paying investment banks on the Street suggesting that before this cyclical bull has run its course, the public will essentially have no choice but to up equity allocations meaningfully. ” ) They are still looking for distribution. The question now is who will be holding the hot potato when the debt implodes into a singularity like Vulcan in the most recent Star Trek re-tooling. Tick… Tock…Tick… Tock…
On the other hand, you could bet that the FED will be able to create enough debt to stop this contraction and that the historic %equity cycle will not overshoot the long run mean for the first time ever. That approach worked very well for many in gold, and many who went long this past year.
EQUITY
The next high is in. Overseas equity is showing red. SPX has come up to the most recent trend line at a time when Volume and trader willingness are both weak.
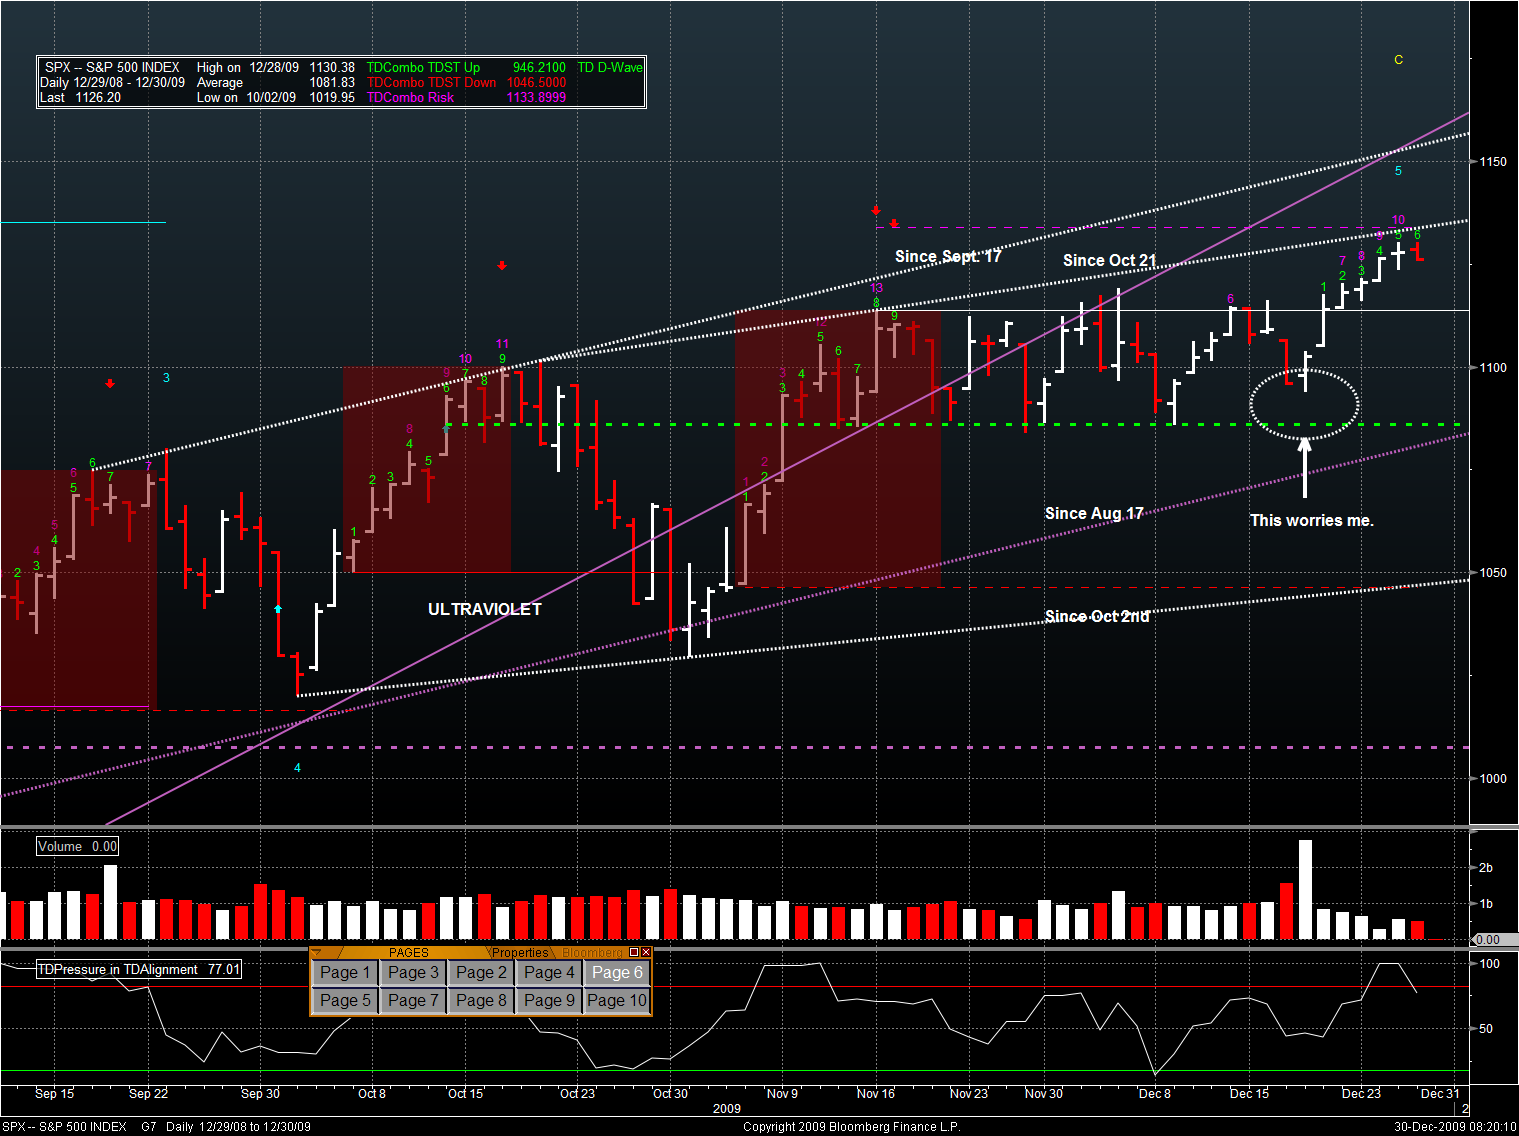
THe weekly SPX chart is much more meaningful, IMHO, for indicating where the more likely paths lie. As I’ve mentioned, the TD SELL setup bar count is at 8 of 9 – meaning that next week should see the completion. To be valid in the count, this week needs to close above 1105.98 and next week needs to close above 1106.41. IF this happens then there is likely to be a 1 – 4 bar reflex retrace. The depth of this retrace will determine if it is a trend changer or merely consolidation before the next wave up. The dashed yellow trend line is at 1122.62 for today, for those who want to play along at home.
As you can see in the chart, the TD wave count is either yellow 4 of 5 (down sequence) or blue 3 of 5 (up sequence). TD wave counts are sequential and NOT nested like EW. If it is a down sequence (which began in September 2007 BTW) then the next wave will need to go below 869 – using TD methodology. If you look closely on the chart, this is around the 23.6% FIB at 878ish, and there is a dashed red line which is a TD risk level. Some TA, eh? Otherwise, blue wave 4 (up sequence) is next – which is a down wave but usually shallow or sideways.
TD also thinks that the current blue 3 of 5 is due for a retrace and this is shown by the blue line marked 1135.10 – which is a retrace level. Further, TD Pressure is in a Low risk SELL mode (since the TD Pressure went back below the red signal line at the bottom of the chart), with a STOP up around 1146. If SPX gets back above 1146 then the trend is still up (of course, that is true for 1135 as well.)
I know this sounds like I’m saying that the market will either go up or down – but that’s always the case. The numbers are to provide road markers for the trip – that’s all.

ES was quite flat overnight until Europe opened. BAM at 4:30AM EST. Support is now being provided by the high from Dec 21, 2009 at 1113ish. This is also a TD risk level. It looks like ES is retracing back there on the daily chart. IMHO it could be the “break the ceiling”; retrace; “take off again” type of play – but the volumes are weak going into year end and I hesitate to stake my cash on this. ES pivots:
- R2: 1131.50 = would be a new high. Not likely on the volumes we’ve seen
- R1: 1126.75 = Where ES peaked yesterday before the NY open. Also the site of a number of TD retrace / resistance indicators. On the 5 minute chart, ES is putting in wave 2 of 5 down and S1 is the new ceiling.
- Neutral: 1123.50 = Looks like resistance from yesterday going into lockup. ES never recovered after that and sold down to S1 when Japan opened
- S1: 1118.75 = current ceiling. acted as support until Europe opened. Sellers came in around 4:30AM EST.
- S2: Sort of acted as a floor – but more support came from 1113.50 which was the high from Dec 21.
If you want to play short, then 1118.75 is where to put it on with a stop above 1121 (TD risk and retrace level). 1115 or 1113 look like possible targets.
If you want to play long, you might want to wait to see if ES retests 1115 or 1113 again into the open.

FX
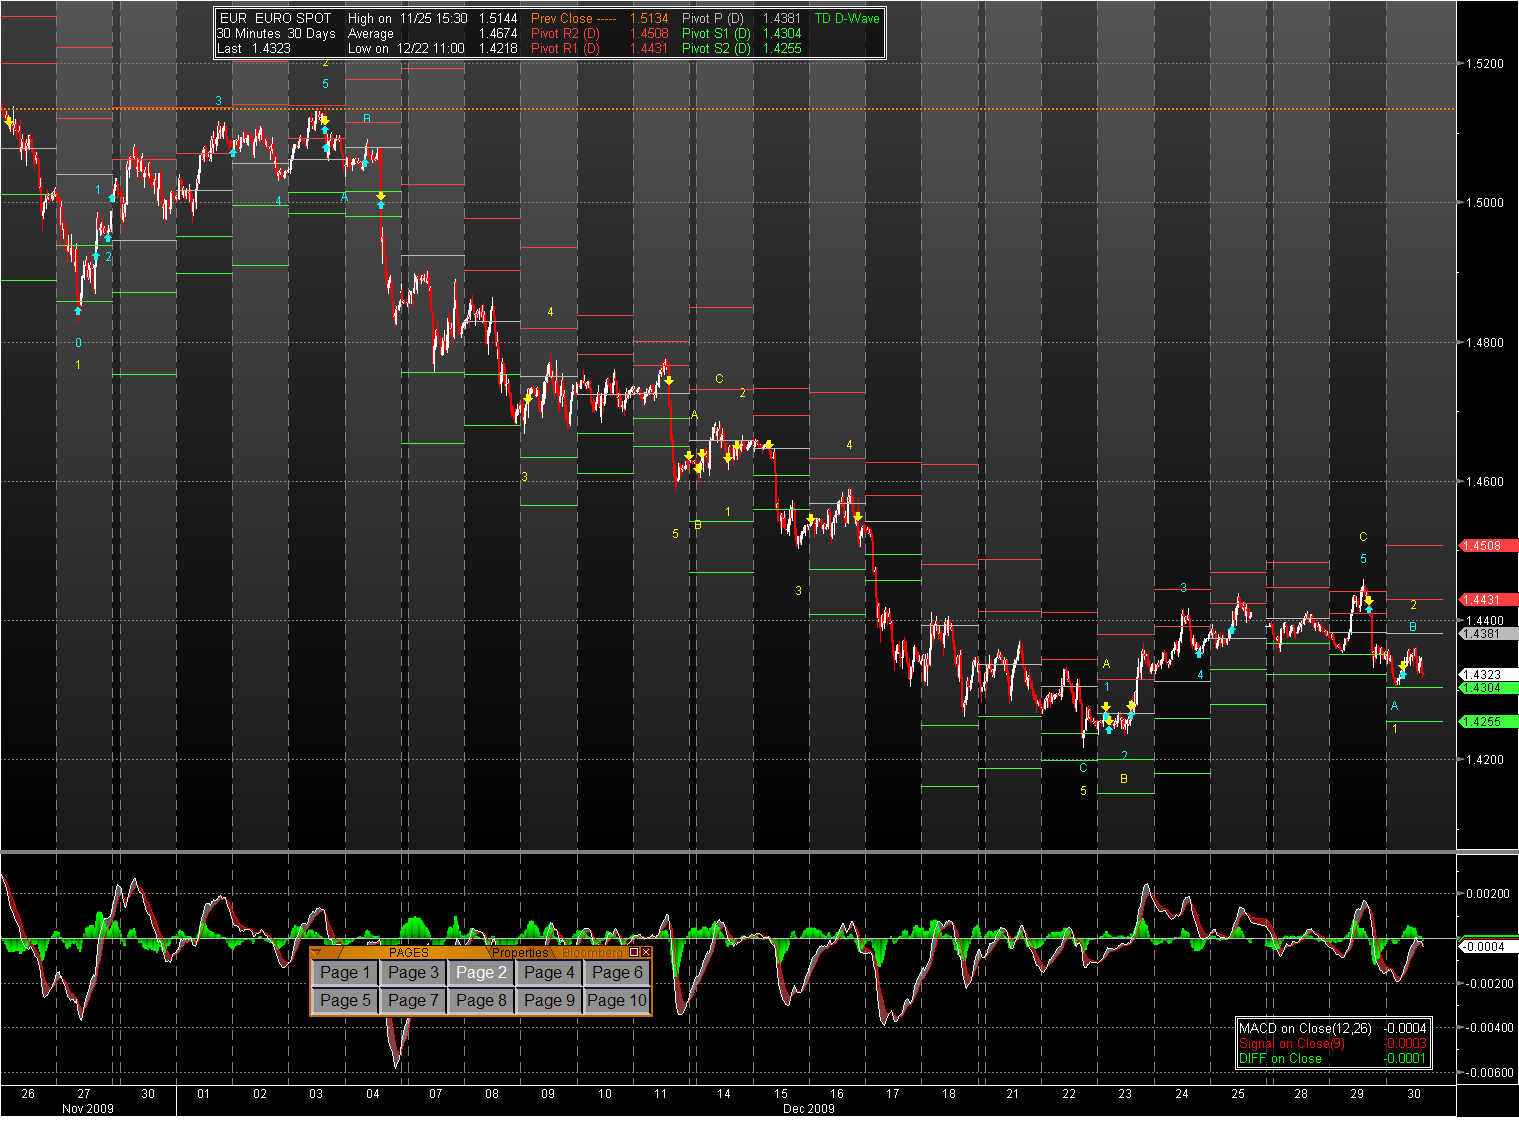
USD is stronger. CAD has been pounded. JPY, EUR, and GBP are all mildly weaker. DXY is struggling to get back up and running into resistance at the pivot at 78.065. As the chart shows, we need time to see if this is a wave 3 of 5 up sequence (the blue numbers) or wave C of ABC yellow – which is all part of the down sequence. Which it is depends on whether or not DXY peaked on Dec 22nd. The 78.298 pivot is critical and needs to be breached for a new high. Again, it’s difficult to read these entrails going into Year end. Suffice to say that the USD is running into resistance overhead – but that the USD /SPX correlation has been weak as of late.

The EUR does look wounded and is being very well behaved in terms of pivots (meaning that the price seems to be responding to pivot levels cleanly). EUR made an attempt to break out yesterday but was unsuccessful. Current floor at 1.4304 is where there has been previous support. The thing about FX is that the market is so large and the leverage so great that it is hard to “wear through” a level. It takes a change of sentiment on the part of one or more players – followed by some stop running.
Enjoy the day!


