


Let’s Talk Volatility
Let’s Talk Volatility
There is something markedly different about the current sell off and I have spent the last few hours assembling pieces of the puzzle into what I hope will be a useful perspective on where we are heading. As you know the analysis of volatility patterns has become somewhat of a hobby of mine and the more I delve into this aspect of price behavior the more fascinating it becomes.
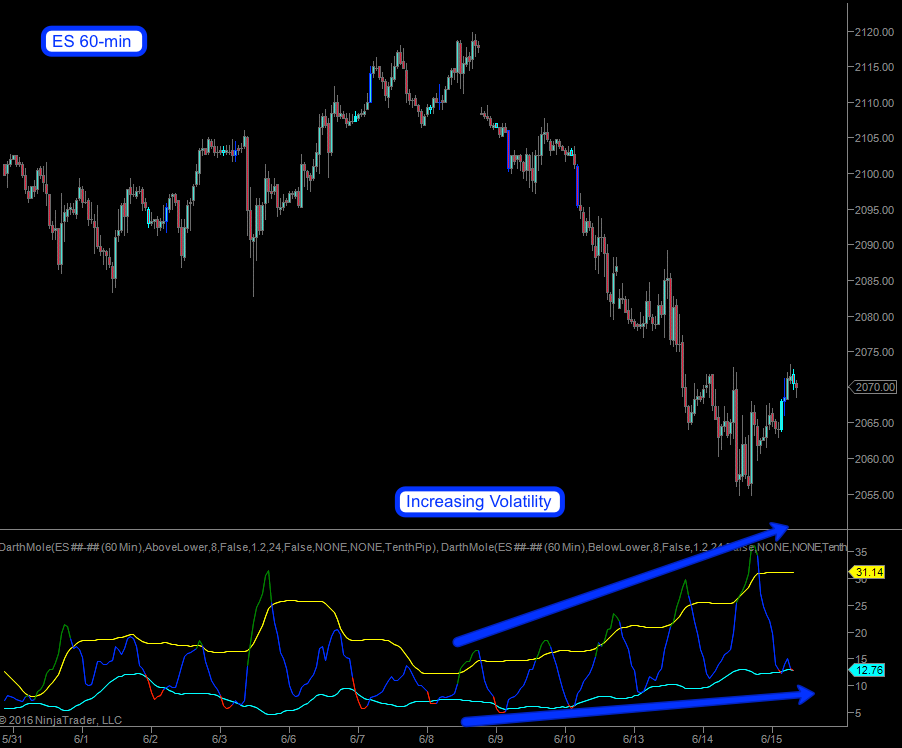
Let’s start with the easy stuff and then work our way up. Here’s the 60-min view on the E-Mini which clearly shows us an expanding volatility profile over the past week. Things started to quietly turn lower near 2100 and then picked up more steam. No surprise there.
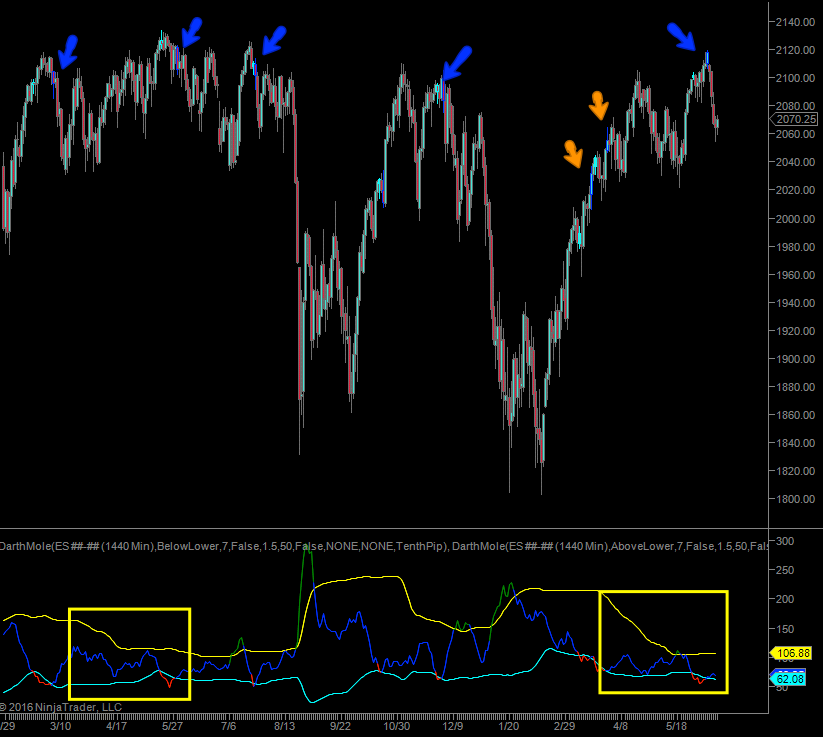
Now here is where it gets interesting. This is a similar view but this time we’re looking at realized volatility on the daily panel. The blue arrows point at candles around which equities basically ran out of steam and transitioned into a corrective period. That is not always a precursor to a medium term retracement but it usually is if it happens near all time highs.
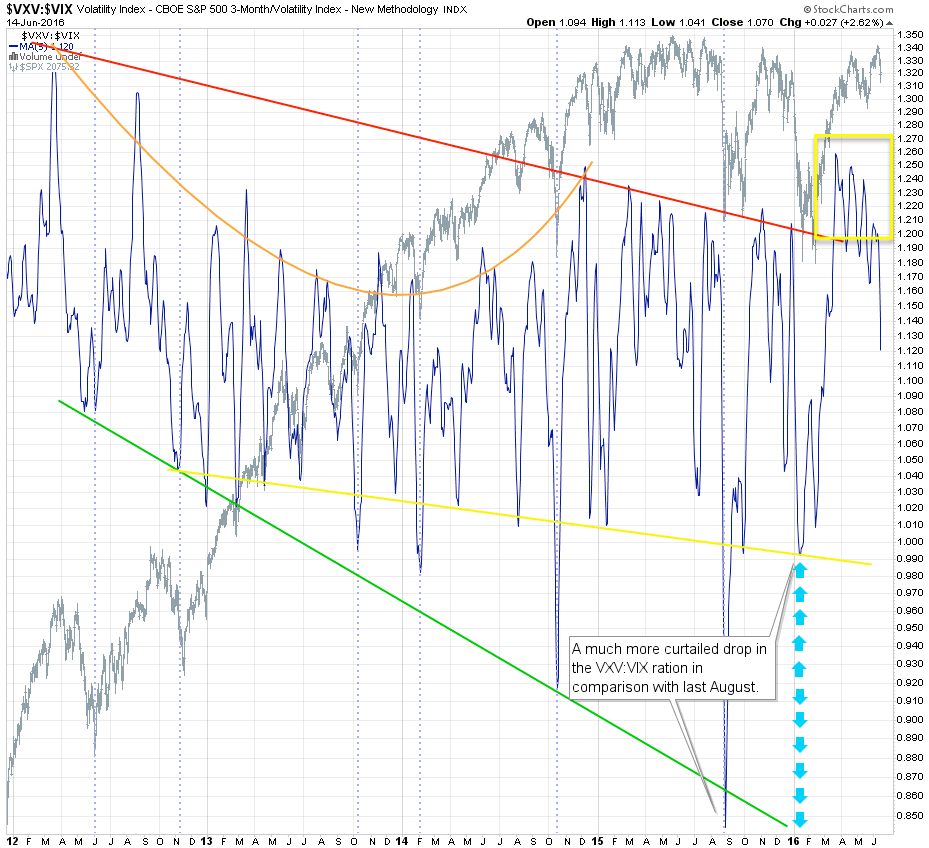
And here is where this story gets even more interesting. As you can see over the past year or so the VXV:VIX ratio has been observing a resistance line that was slowly descending between 1.24 and 1.2 as of right now. So when we pushed toward 1.25 it was clear that we were near the end of the advance. However after having experienced eight years plastered with bear traps I was wise enough to not immediately suggest that a high was in place. Instead what I was looking for was a pronounced divergence followed by price confirmation. Which pretty much brings us to the situation right now.
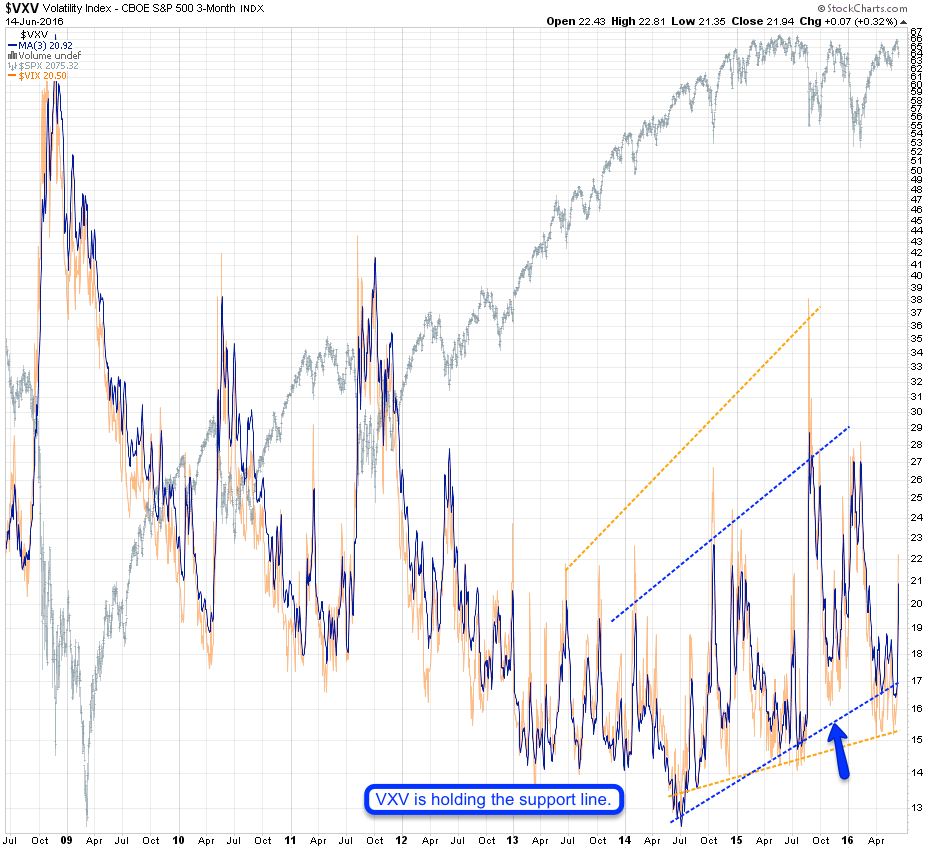
Before we move on let’s look at the VXV and the VIX as separate plots. About Two months ago I pointed out a steepening on the (blue) VXV in comparison with the more short term (orange) VIX. Even during the recent highs the VIX held that line which means that on a more long term basis, i.e. around a 90 day window, risk sellers continued to price LT risk above short term risk. Based on what I am seeing here that has not happened during this entire bull market.
However I did mention in my intro that there’s something markedly different about this sell off and I think you are very much going to enjoy the next chart. Please grab your secret decoder ring and meet me in the lair:

It's not too late - learn how to consistently trade without worrying about the news, the clickbait, the daily drama and misinformation. If you are interested in becoming a subscriber then don't waste time and sign up here. The Zero indicator service also offers access to all Gold posts, so you actually get double the bang for your buck.
Please login or subscribe here to see the remainder of this post.


