


Post Election Volatility Changes In Equities
Post Election Volatility Changes In Equities
If you have been visiting regularly then you probably recall some of my earlier posts on realized volatility [1][2]. For the rest of you here’s a quick recap as it’s important to understand what realized volatility (RV) is and how it compares to implied volatility (IV). Simply RV measures the amount and amplitude of price change observed in a financial instrument over time. Big moves to the up side and down side will both produce spikes in RV. As such the volatility we measure or predict always produces an unsigned return – it does not care whether the market goes up or down.
Implied volatility (IV) also produces an unsigned return but it works a little differently. A widely observed measure of IV in equities is the VIX, which rises when prices fall, and falls when prices are on the rise. However it never even gets close to the zero mark and there are no negative readings. The reason for that are pretty simple – IV’s goal is to measure the expectation of volatility and as such rising prices are considered positive and thus less ‘volatile’ as falling prices. One could say that IV measures how investors/traders ‘feel’ about the market and what they expect will happen in the future. This also explains why you will often see the VIX fall a little after a big IV spike to the upside. Although fear most likely prevails the expectation is that the probability of more downside (in the underlying) is now more limited. As such IV is a bit of a strange beast and many traders use it on a daily basis without fully appreciating what it really represents.
Realized volatility cycles aren’t exactly clear cut either but can generally be separated into the following phases:
- High Volatility
- Depleting Volatility
- Low Volatility
- Rising Volatility
How Did We Get Here?
It is important to keep in mind that market direction needs to be separated from RV and thus you may find yourself in a high volatile sideways market, a low volatility trending market, or perhaps a trending market with depleting volatility. Most traders as well investors focus solely on market direction but not how it got here. It’s the difference between a drag race (straight and no curves), a Formula 1 race (straights and mixed curves), or a NASCAR race (in essence one big oval). As such the point of this post is to highlight the fact that a change in volatility can offer us important clues as to the nature of the market and where it may be heading next. In other words we are attempting to read between the candles 
Now that we are all on the same page let’s take a look at a few charts and focus in particular on the shift in RV we have been observing since the November 8th election, which apparently has triggered a pronounced change in short term market behavior.
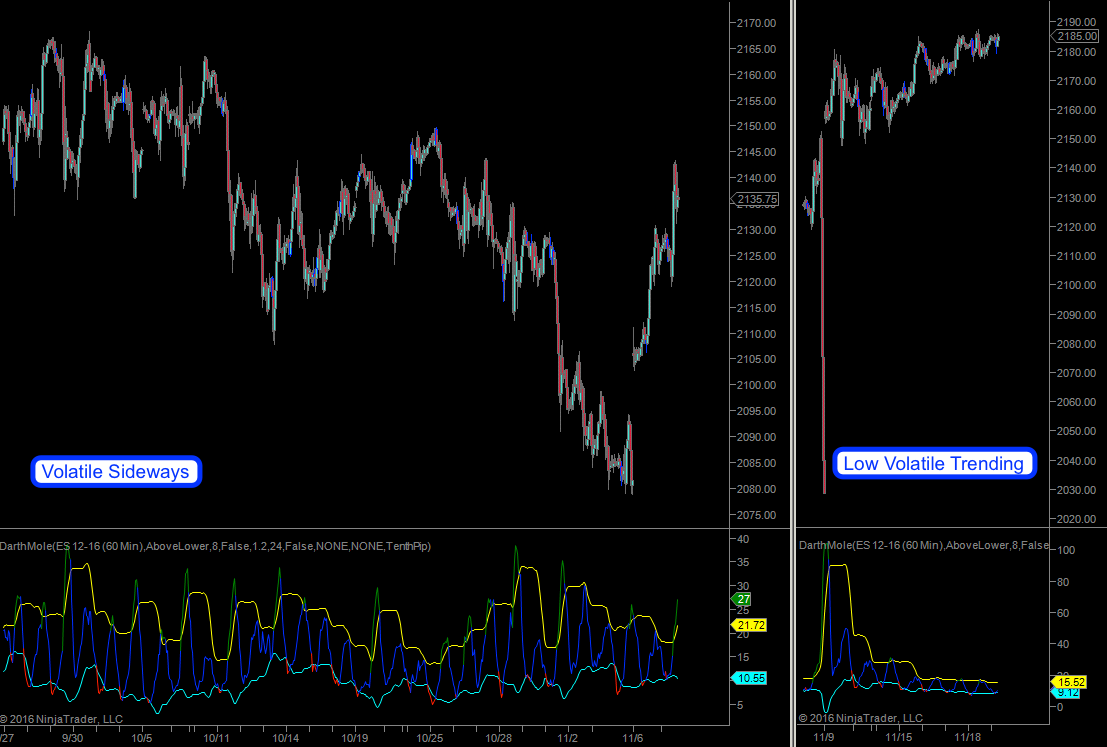
And nowhere is that change more drastic than in across equities. In order to properly visualize this shift in short term market behavior I decided to separate my hourly panel into two, with the left showing the period ahead of the election and the right curtailed to only the election spike and the ensuing aftermath until today.
The first chart above shows the S&P 500 December futures contract, a.k.a. the ES or the spoos (by some of the old timers). On the bottom panels I am using a slightly modified version of the ATR with a Bollinger around it. This affords me the ability to discern between the amplitudes and the frequencies/phases of the waves produced by the constant ebb and flow of volatility. This is actually a fascinating topic by itself which I have covered on several occasions. For now let’s limit ourselves to what’s in front of us and on the left panel I would describe it as a volatile sideways market, which I am sure very few of us are missing.
Now look at the signal on the lower right panel and how short term RV has been rapidly depleting since the November 8 election. At the same time price has been advancing steadily in a pattern of higher highs and higher lows. The clear message here is to not second guess this advance and to wait for a burst of volatility accompanied by a topping pattern. To be even more clear: Do not attempt to short this tape until further notice.
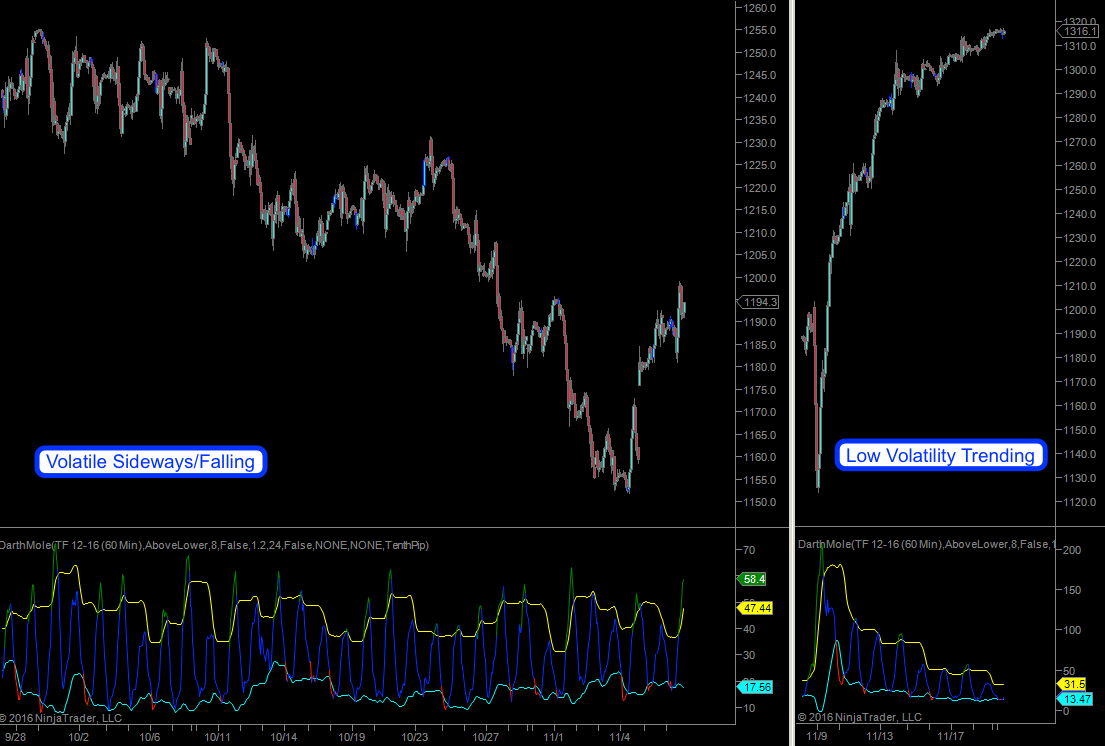
The change in RV is even more apparent on the TF or Russell 2000 futures in that it switched from a volatile sideways/falling mess into a raging low volatility trending rocket. Clearly it’s running a bit out of steam now and may be painting an obligatory correction. But let’s not forget that Thursday is Thanksgiving and I do not believe many traders would want to go short here ahead of the long weekend.
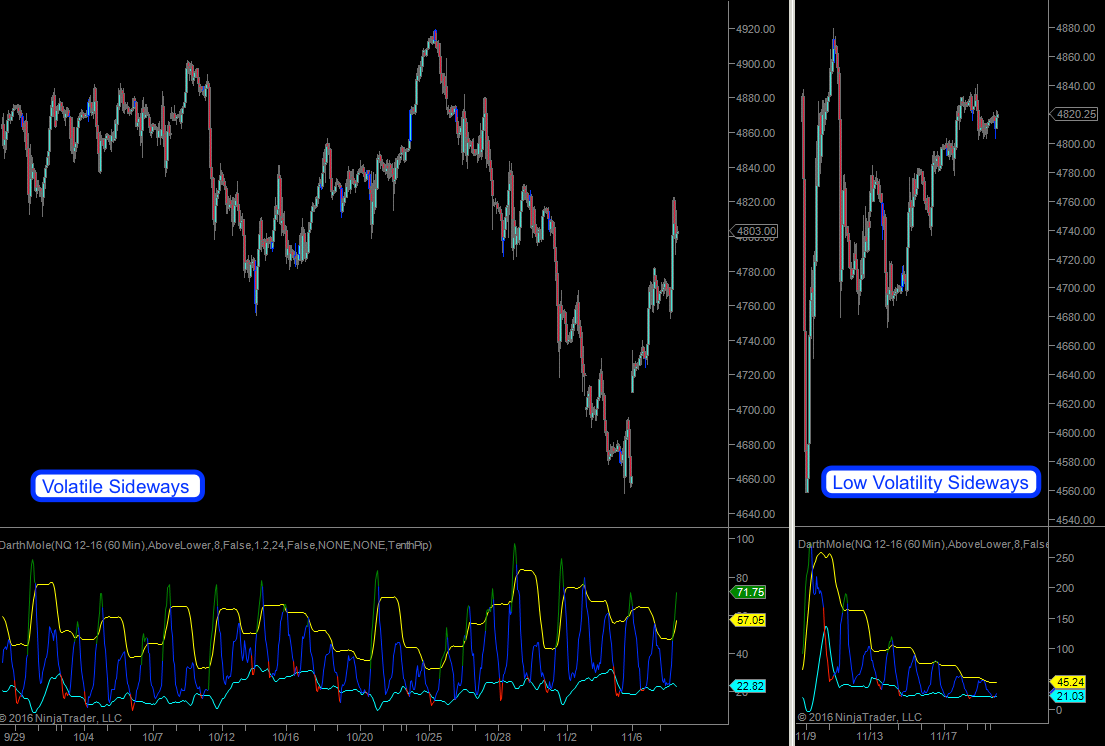
The Nasdaq futures in contrast have been changing from a volatile sideways headache into an more annoying low volatile sideways one (with rising tendencies). What does this tell us? There are better/easier fish to fry and I wouldn’t want to touch this one with a ten foot pole.
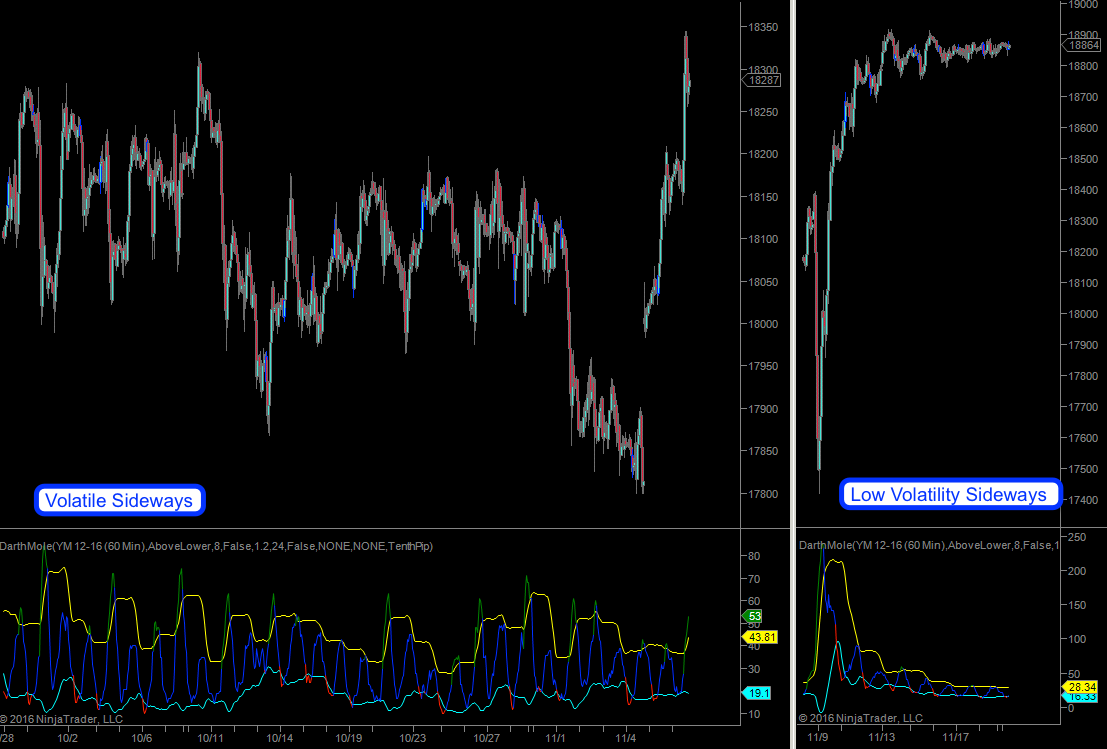
Finally the Dow Futures which are interesting from two perspectives. One the change in volatility is even more drastic than on any of the previous ones – we went from highly volatile sideways to low volatility trending in two seconds flat. The reason I labeled it sideways is because it quickly fizzled out after the first few sessions and is now pushing completely sideways. In other words it switched from being the leading index to being the laggard. Or perhaps it is leading us into a correction?
That is a typical mistake many traders make actually. They see a symbol slow down and immediately fall into the trap of calling a high or a low. Quite frankly it is rare to see an instrument just rise, roll over, and then start correcting lower. Usually we see a meaningful high being followed by a rise in RV during the course of a retest. Low volatility sell offs (i.e. downside trending markets) do happen but they usually occur as part of an established medium term correction, or a genuine bear market. They do not suddenly appear out of thin air.
So the lesson here to be learned is: Maybe it is leading us lower but let’s watch for RV to pick up first.
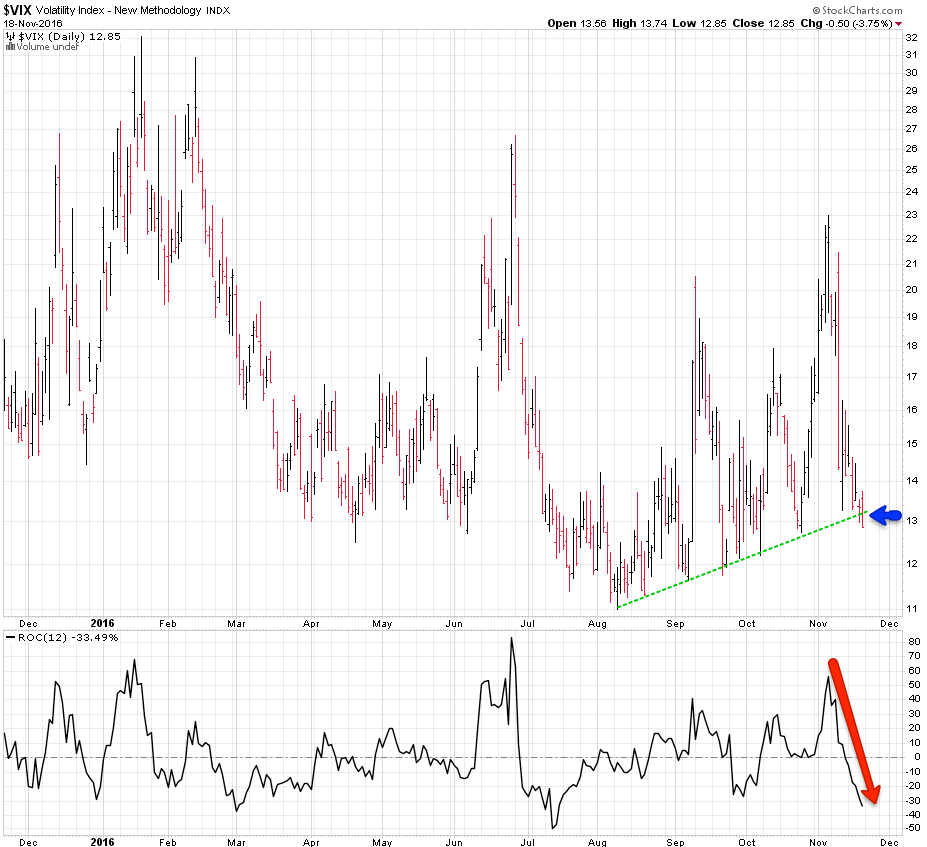
Now let’s quickly talk about implied volatilty as expressed by the CBOE VIX and its longer term cousin, the VXV. The VIX on it own has dropped like the proverbial rock over the past two weeks from 23 to low 13 yesterday – a change of 47%. I don’t think any of the surviving bears is eager to step back up to the plate here anytime soon. Which is exactly why I believe that a short term shake out may be well timed ahead of Thanksgiving. More longer term the touch of our diagonal trendline represents an inflection point: Either prices embark on a correction or we drop back towards 12 or even 11 after the holidays. Which may actually be a negative scenario for the bulls. Thus as strange as it may sound a small correction now is more bullish on a medium term basis and the inverse.

Finally the VXV:VIX ratio has us somewhere back in the center which leaves plenty of momentum for more upside over the coming weeks. I don’t see anything here that screams that an impending medium term correction is lurking beyond the horizon. Which is no guarantee of course but technically speaking we seem to be in the clear for now.
Since this has been fun here’s a bit more volatility magic for my intrepid subs:

It's not too late - learn how to consistently trade without worrying about the news, the clickbait, the daily drama and misinformation. If you are interested in becoming a subscriber then don't waste time and sign up here. The Zero indicator service also offers access to all Gold posts, so you actually get double the bang for your buck.
Please login or subscribe here to see the remainder of this post.


