


gmak Pre-Market Warm Up
gmak Pre-Market Warm Up
Up is down, old is new, and the economic outlook is one of growth again – even after it was in doubt in the second half of last week. Who cares? No trader should. Play the market you are given, and remember that it is not driven by fundamentals.
This bare bones chart shows that TA says SPX is running out of steam. SPX still is seeing higher highs and higher lows, but MACD has crossed bearish, RSI is sloping down, volume has been declining (except on down days) and TD Pressure says price is headed down.
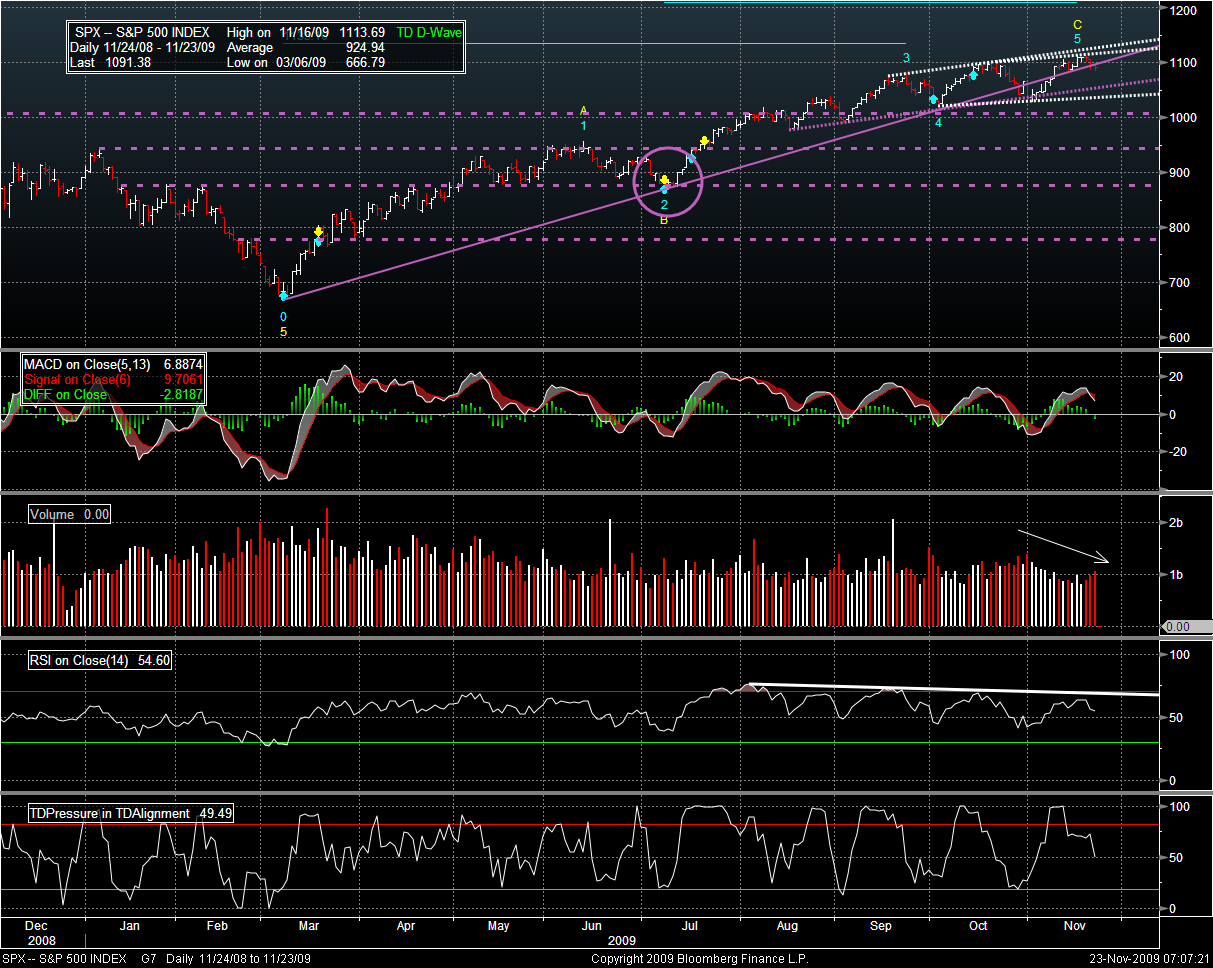
The dashed violet lines are all horizontal and based on resistance highs from the fall between October 2008 and March 2009. Here is a clearer view:
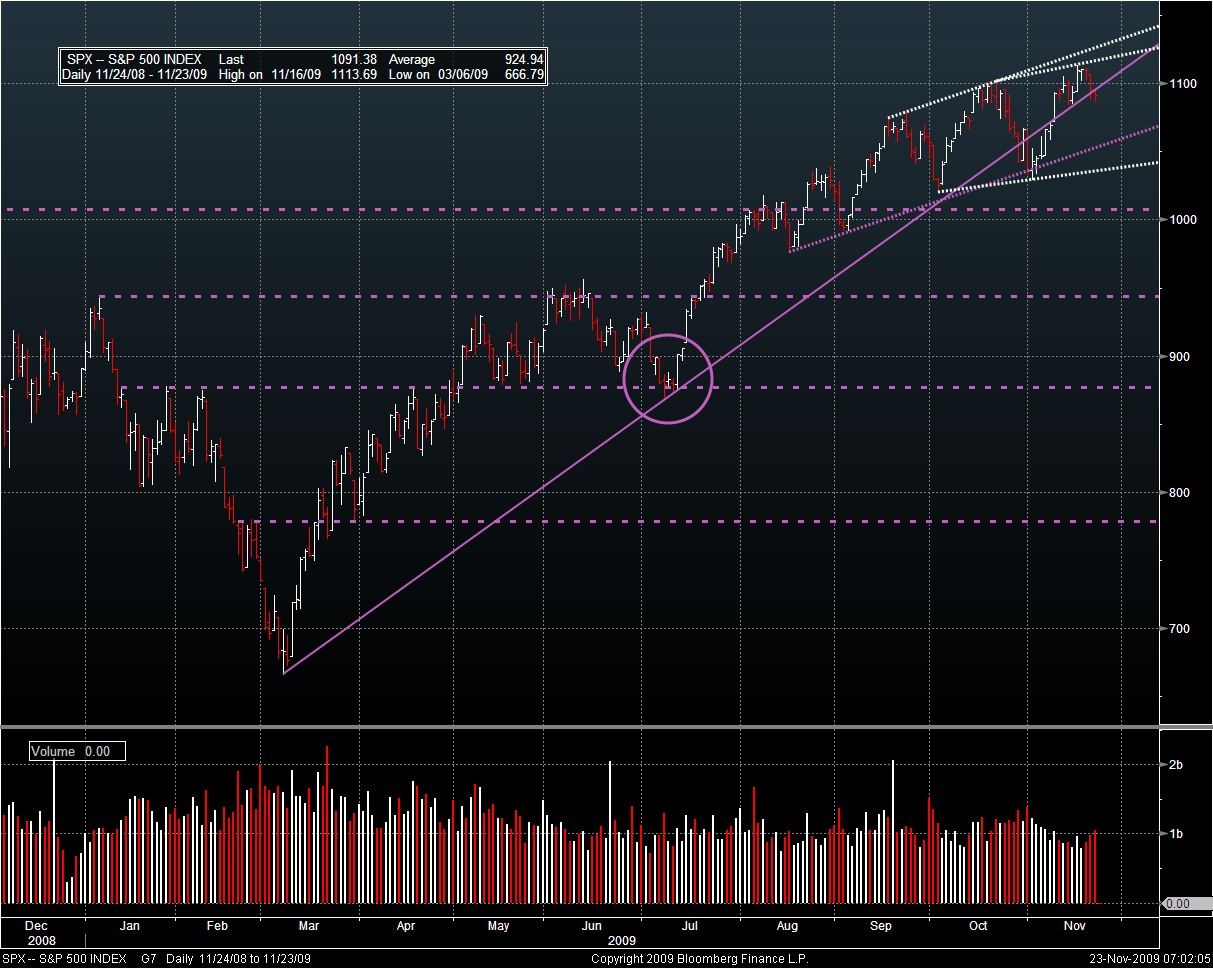
Points of resistance and support are obvious. The 2nd derivative of SPX is declining. The overall trend is still up, but it is looking tired. Look at the purple circle where wave 2 or B are marked. Move forward to where the first dotted purple trend line begins (not dashed horizontal). See how there was a local high, 2 down days, and then another bump higher? That is what I believe we will experience going forward, based on the sudden reversal of most trends from last week. This next chart has some FIBs, trend lines, and bollingers added.
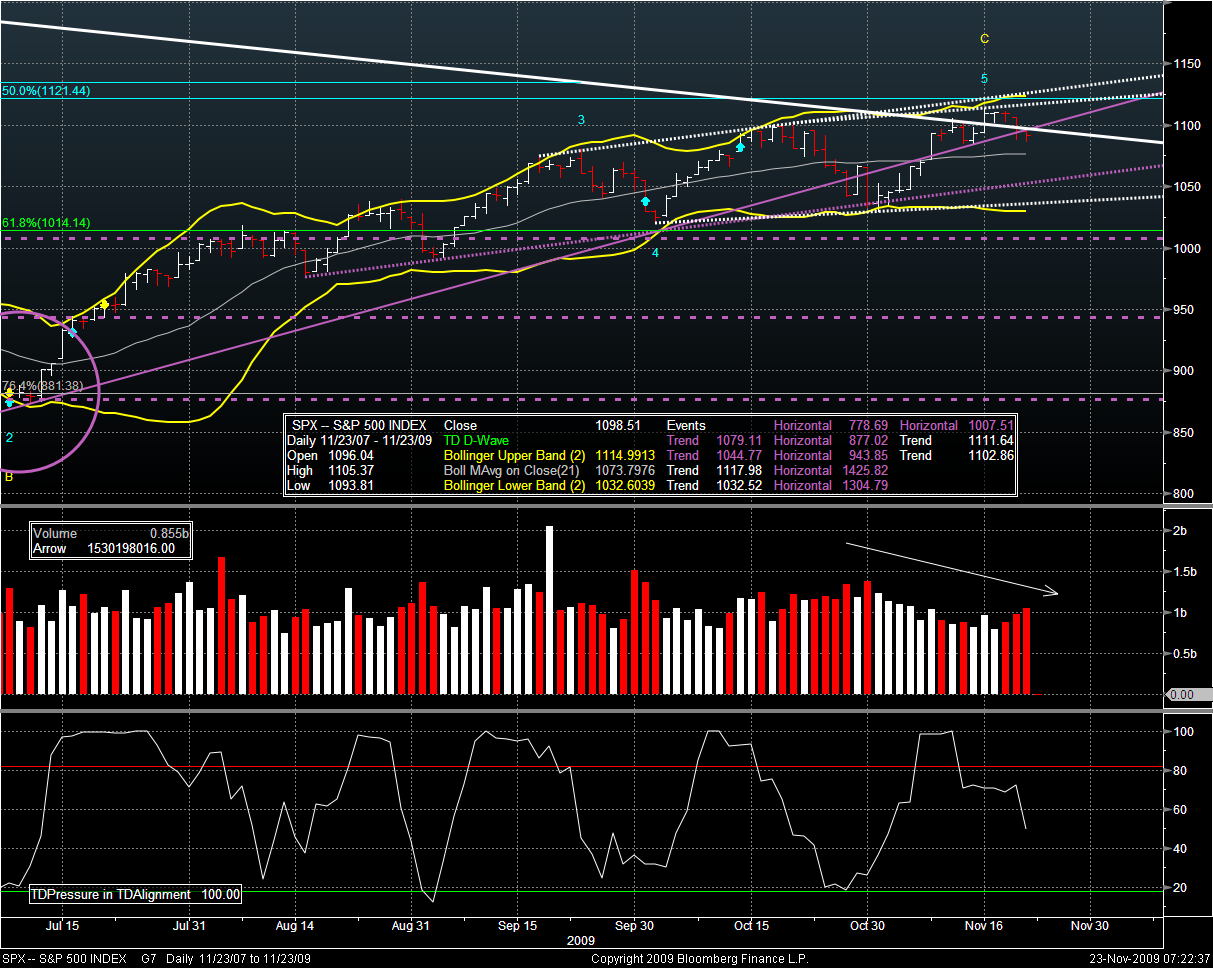
What is telling is that SPX is back below the BIG WHITE trend line, suggesting an overthrow. Liquidity is entering the financial system (USD down, GOLD up) and this may take SPX back up to the first dotted white line above to put in a new high. The key is where SPX closes today, above ULTRAVIOLET (the solid purple trend line), or below Friday’s close. It is telling to me that SPX is BELOW the juncture of BIG WHITE and ULTRAVIOLET. The trend is changing.
Would I play today? No. The TA says down, but the USD says up. This contradiction or disconnect makes the risk /reward ratio too high, IMHO. I am NOT trying to catch the exact top. I am trying to play what the market is giving me. The general trend is still up, so it is easier to make money long than trying to swim against the current. However, the TA says that SPX should be headed down. At the same time, pre-market moves suggest we might be seeing AUG 14 timeframe again. See? Too much risk for the reward. If one goes long, then only if SPX gets below the mid-bollinger can one be sure that the bet is wrong. If one goes short, then only if the last high is exceeded can one be sure that the bet is wrong. Both are too far away, IMHO, given the uncertainty of direction in the market.
Equity
Asia was mixed, but all the main markets (except Nikkei 225) were green. China was up almost a percent. Europe is as green as Al Gore’s public persona. The DAX is up 1.6% and it looks like only one or two companies in Health Care are down. The rally is broad based and across the board – which suggests liquidity-driven to me, given the sentiment of last week.
The DAX did the old Ramp and Camp, and I would expect the same for SPX today.
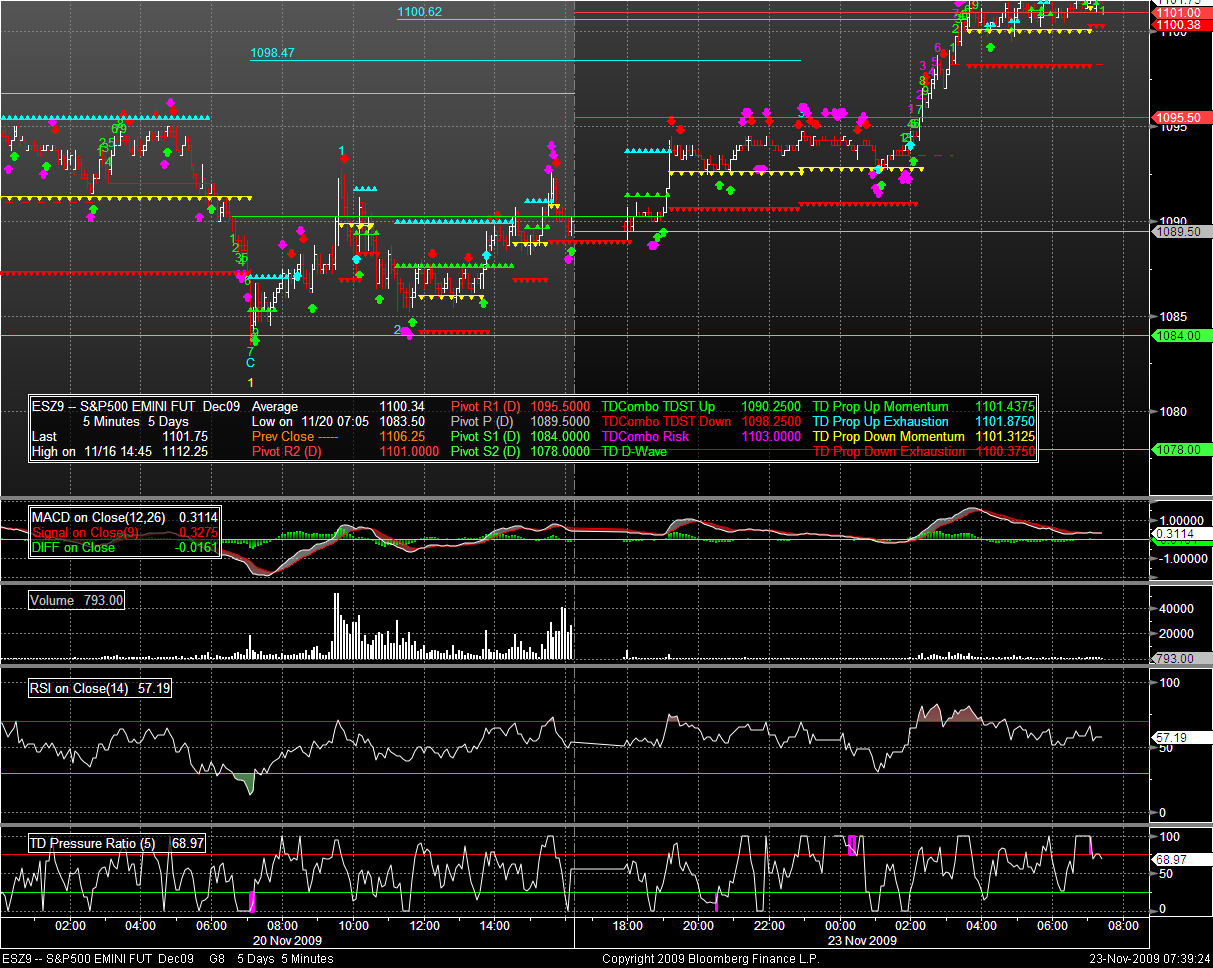
ES did exactly the same think as soon as Europe opened. Ramp and Camp. Quite a reversal from the Fall and Crawl of last Thursday, no? ES pivots of note:
- R2: 1101 – We are here right now, using it as a floor. All the TD SELL counts say it should fall – but we all know better given the USD and GOLD
- R1: 1095.50 – This was resistance on Friday before the NY open.
- Neutral: 1089.50 – This was resistance before the Sunday open
- S1: 1084 – was the launch pad for the latest move up from Friday at 8AM EST
- S2: 1078 – I’d forgotten that numbers went this low.
This is Turkey week but I don’t think the fractal from past years will apply. Shorting here, IMHO, is a mugs game. I believe it is better to wait until there is agreement between the TA and the SPX as to direction, no?
FX
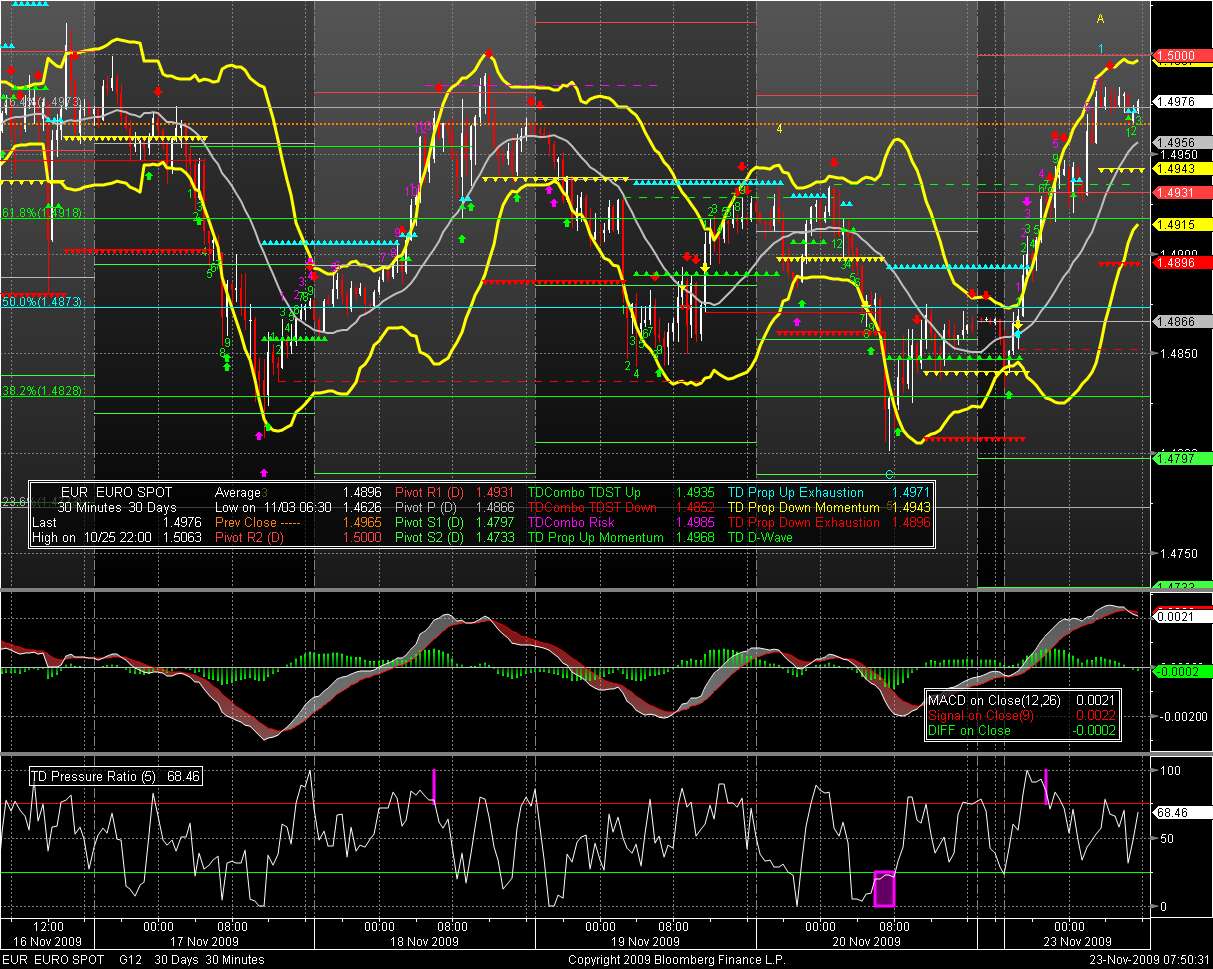
USD is down. DXY was unable to hold above the 75.662 level, however a higher high has been put in. If DXY goes below 74.90, I would suggest that it will be setting new lows. If it holds above, then there is a chance that the up trend can continue.
Oddly enough, the EUR has put in a top just below the last high at 1.4990 (the last “higher high” was 1.4991) I’m clutching at straws a bit here, but the trend TA still says down until a higher high is put in.
NEWS
DATA
Stay loose. Don’t be too anxious to commit capital until the TA and price action line up.
Cheers.
1:40PM EST
Just updated Geronimo stats and Graphs


