


Let’s Talk About SKEW
Let’s Talk About SKEW
I’m as surprised as you may be seeing equities head straight lower overnight. As you know I was actually positioned both long (ES) and short (NQ) expecting a break out after obvious signs of distribution. Things are clearly very confusing right now – yes, I phrased it this way intentionally. So let me explain what I mean, starting by talking about SKEW.

A lot of noobs here so let’s cover the basics real quick – I lifted this right off of the CBOE’s page:
The CBOE SKEW Index (“SKEW”) is an index derived from the price of S&P 500 tail risk. Similar to VIX, the price of S&P 500 tail risk is calculated from the prices of S&P 500 out-of-the-money options. SKEW typically ranges from 100 to 150. A SKEW value of 100 means that the perceived distribution of S&P 500 log-returns is normal, and the probability of outlier returns is therefore negligible. As SKEW rises above 100, the left tail of the S&P 500 distribution acquires more weight, and the probabilities of outlier returns become more significant. One can estimate these probabilities from the value of SKEW. Since an increase in perceived tail risk increases the relative demand for low strike puts, increases in SKEW also correspond to an overall steepening of the curve of implied volatilities, familiar to option traders as the “skew”.

That last part is pretty important. So let’s take a quick look at the option smile right now today for the Spiders. I have marked two different concepts on that chart. One is called intra-month SKEW and the other is called inter-month SKEW.
Intra-Month Skew
Observing only intra-month SKEW you typically see the lowest implied volatility (IV) on the at-the-money (ATM) strike or near it. You can see that IV slopes away from the ATM strike and upward, and that is pretty typical for stock and stock-index options like the Spiders. The left slope which shows the IV for OTM puts is also usually steeper than that for OTM calls. After all almost everyone defines risk in the context of loss, in particular as bearish participants are usually a small minority (of course that varies).
Still with me? Good. So that’s the main reason why you see OTM calls being priced a lot lower than OTM puts located the same number of strikes away from ATM (e.g. five strikes below ATM compared with five strikes above ATM). That’s pretty normal – especially stock and stock index options usually don a crooked smile that’s pulling hard up to the left.
Inter-Month Skew
With inter-month SKEW, the same is also true. If the March expiration shows a higher IV than for instance the June expiration (as we’re seeing right now above), then market makers expect larger price changes during the contract showing the higher curve (i.e. March). There is one caveat however with interpreting intra-month skew when contracts are nearing their expiration. An option’s vega expresses the change in the price of the option for every 1% change in underlying volatility. Read that one again. Vega however isn’t always the same during an option’s lifetime. It starts out high (as there’s a ton of time left, which means uncertainty about the future) and then slowly decreases to nothing at expiration day when they start resembling little futures contracts. Falling vega in turn can rise IV and thus steepen the skew. That doesn’t mean the market is seeing large price changes at expiration, although it’s possible, but rather it’s due to a confluence of expiration and low vega.
Putting It Into Practice
Anyway, now that you understand the concept of SKEW and option smiles let’s revisit those two charts. The first shows us that we’ve been in a pretty solid range for the past year or so. And actually right now SKEW is historically low in comparison to where it was a month ago. Which means market makers are not expecting a big drop right here right now. Of course it’s fair to point out that they didn’t expect one last August either 😉
The option smile curve on the Spiders (our second chart) doesn’t really look very unusual although I would say that it’s a bit steeper than what we’ve been seeing over the past few years. I tried to use the TOS thinkBack feature to show you the smile back when but couldn’t figure it out – they’ve ‘improved’ their interface to the point where nobody really can sort through the kitchen sink of features they’ve thrown at it.
Let’s Summarize
So summarizing all that: The current drop could easily just be a bear trap or it may just catch everyone by surprise and catch momentum. I don’t have a crystal ball but seeing a possible inflection point yesterday I decided to get positioned both ways, knowing that a break out would probably:
- Happen when I least expected.
- Happen to either the up or down side.
I had no control over the timing or the direction. But I knew one thing – namely that the tape behaved like it was near an important inflection point. And that is usually the best time to strike the iron.
What Happens Next?
Your guess is as good as mine and I don’t get paid to predict the future. My job is to ride the tape’s coat tails as best I can and that is exactly what we do here at Evil Speculator. Leave it up to the muppets and bubble heads in the financial media to serve up mutually contradictory interpretations and predictions about what may lie ahead. Here we fade the noise and simply trade the tape that’s ahead of us.
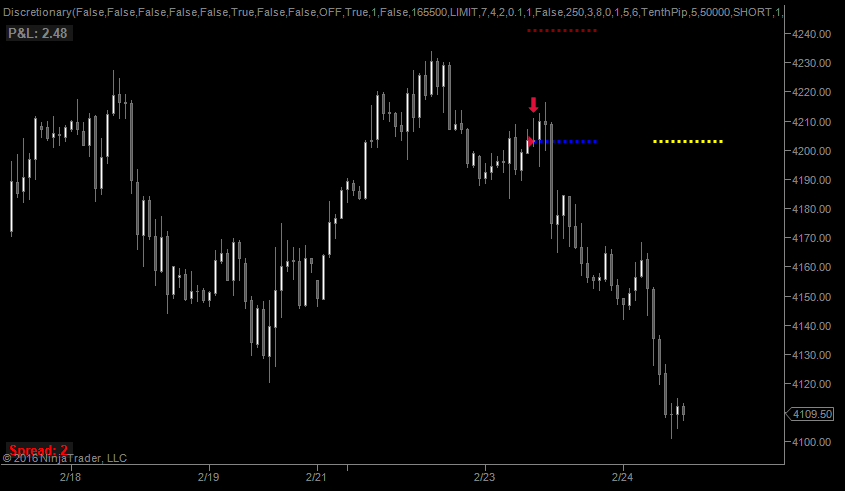
Speaking of which – my NQ campaign is now at 2.5R but I’m sure there will be a counter swing today. Which is fine as my stop has been advanced to the break/even mark. Keeping this one looser than loose for now.
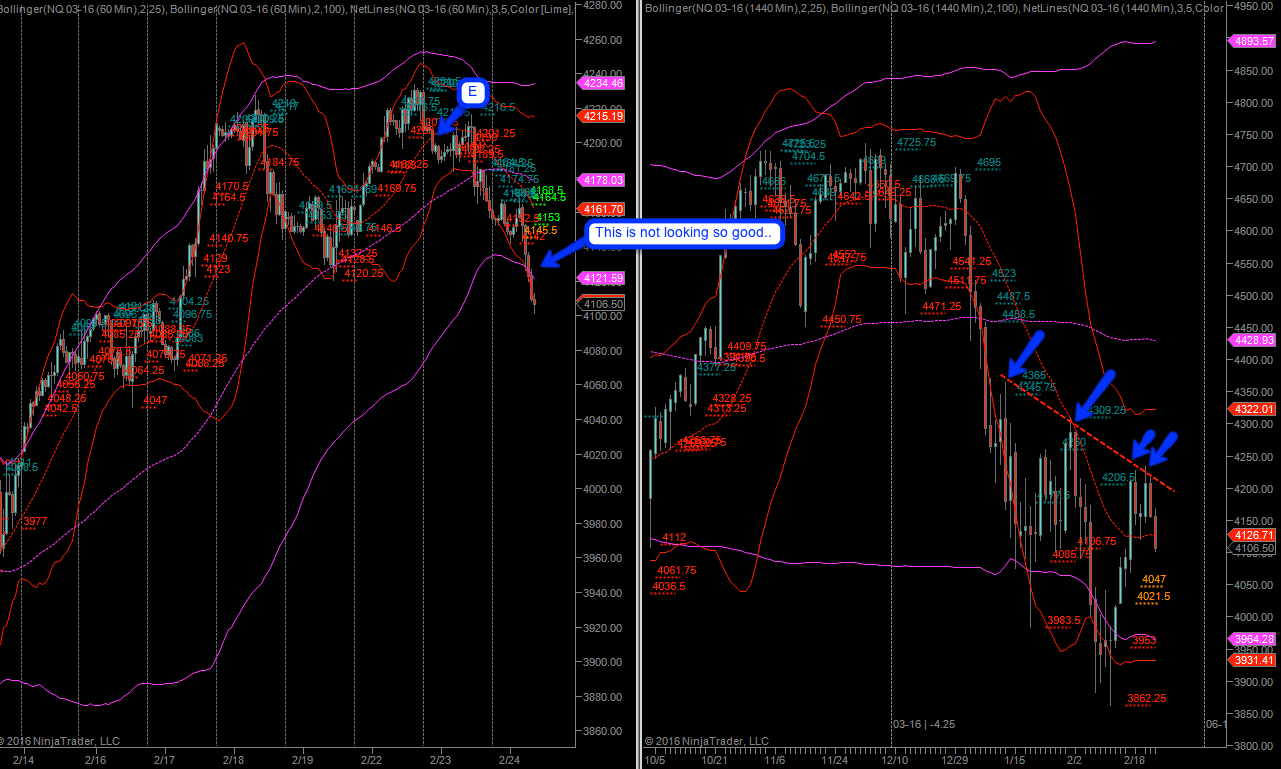
Here’s the hourly panel which looks promising – unless that lower 100-hour Bollinger can be regained in the next few hours we may be looking at a slide today. Again I would be very surprised but as timing appears to be premature.

Long term the NQ is really what we should be following right now. It’s barely holding above that diagonal I painted on the weekly and note that we’re also still below that 100-week SMA. Similar story on the monthly which has us near two monthly NLSLs and below the 25-month SMA. Should we close February below it then I expect nasty things to happen over in the woodshed.
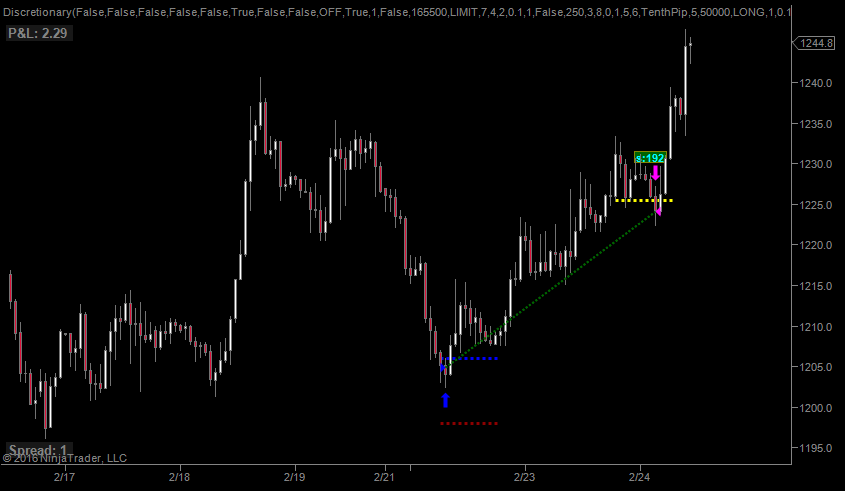
Yesterday’s gold campain. We traded this one last week and now we caught a perfect entry to the upside (yes, subs only). However the damn thing managed to snag my lazy trail overnight. I must have lost out on 2R here. Insolence!!!
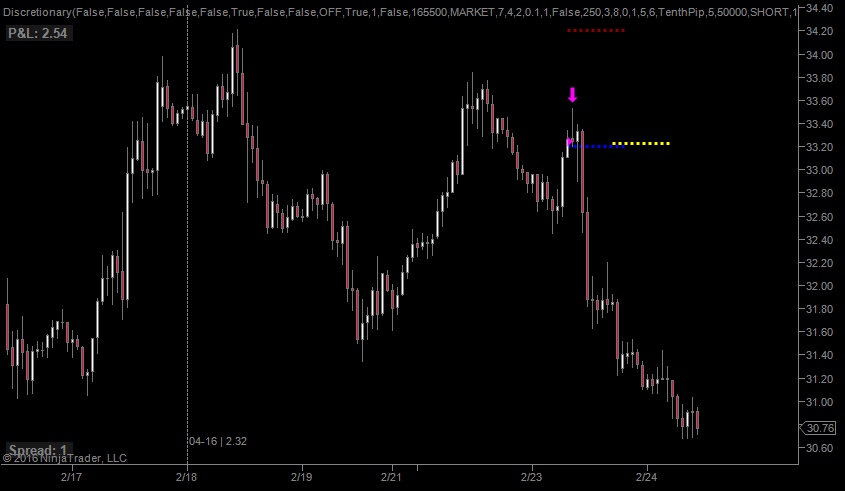
Crude – steady as she goes. That was a picture perfect RTV entry – now it’s in the hands of Mrs. Market to line the Mole’s pockets with plenty of ill-gotten gains. If you’re haven’t already – consider joining out little community of market megalomaniacs – if you have a penchant for taking candy from hapless babies or have felt tempted to challenge innocent passerbies arm wrestling matches then you may just fit right in.

It’s not too late – learn how to consistently bank coin without news, drama, and all the misinformation. If you are interested in becoming a subscriber then don’t waste time and sign up here. The Zero indicator service also offers access to all Gold posts, so you actually get double the bang for your buck.
Cheers,


