


Live Tape Reading W1217
Live Tape Reading W1217
During my time away it didn’t escape my attention that you guys very much enjoyed Scott’s excerpts on tape reading. As you all know I am very much a systemic trader at this point but at the same time still enjoy following a variety of charts on a discretionary/analytical basis for three reasons: First I happen to be good at it as my thinking process follows a mixture between the analytical and the creative. Second it gives me opportunities for campaigns I would miss out on just focusing on my systems. Third reading the tape actually gives me ideas for building new automated systems. For all these reasons and more I decided to do one post exclusive to tape reading every week going forward. Let’s dive right in.
The Zero showed me a possible long entry late in the session yesterday which I however pulled as I didn’t want to hold this position overnight. How come? What are my criteria for holding a campaign overnight?

Well, for starters yesterday’s short term campaign was based on a signal on the Zero (shown above) which should have resolved upward at the end of the session. Unfortunately however we only got a little bounce followed by a reversal. Now had there been other context I may have left it in place, but unfortunately there wasn’t much to hang my hat on.
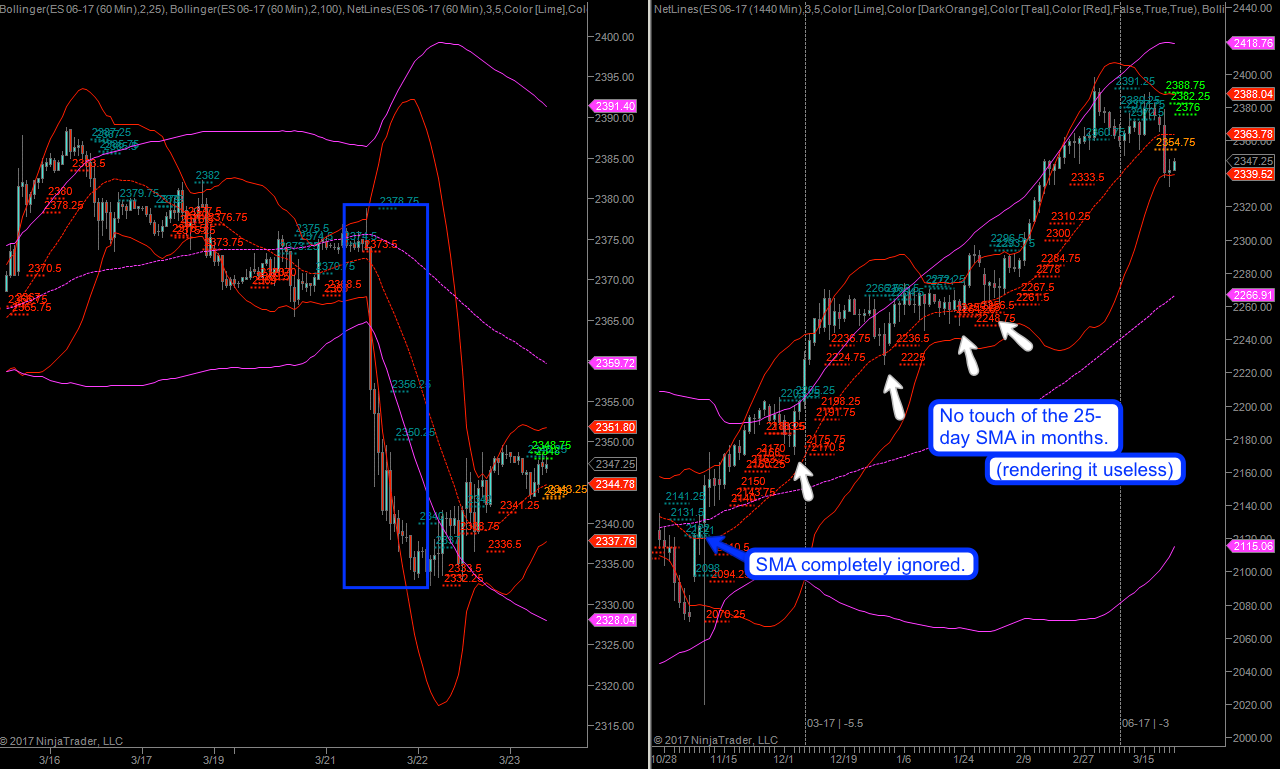
If you take another peek at the first chart you’ll notice a few things. The only support context I see on the daily panel *appears to be* the 25-day SMA. But let’s remember that this is nothing but my personal ‘lens’, which I settled on after years of observation and then continued to use as it actually produced statistically verifiable context suggesting that a bounce happened 65% of the time if the next two candles recovered above it after a breach or touch. No succeeding candle was allowed to continue lower. I will actually produce a scatter chart and prove it, just like Scott showed you in a future post, but for now let’s just take it as a given.
Now I may also point out something which Scott may not have covered. And that is that certain observations are extremely difficult to test completely. As you can see I have drawn white arrows at a series of spike lows on the E-Mini. The reason for doing so is that none of them actually touched the damn SMA. Plus the most recent price touch shows no sign of observing it as it just continued higher as if it wasn’t there.
BECAUSE IT ISN’T.
I think this is one of those lessons many traders have a hard time embracing. Whatever context you use, and even if you have statistically proven evidence that it is real, at some point or other fails to have any value. Sometime that’s only for a few days, sometimes weeks, and often even months. And then suddenly it starts working again. The trick is to gather statistically sufficient data that shows you that there is an edge in the first place (again see Scott’s post on how to do this). Once you have conclusive evidence you need to figure out when it works and when it stops working. Sometimes there will be signs preceding or accompanying it – but more often it will simply stop for no apparent reason. Accepting this and responding appropriately is a topic in its own, which again we will cover sometime in the future.
So in summary, I didn’t want to continue holding what was a small speculative long position because the odds of failure near the EOS outweighed the odds of success.
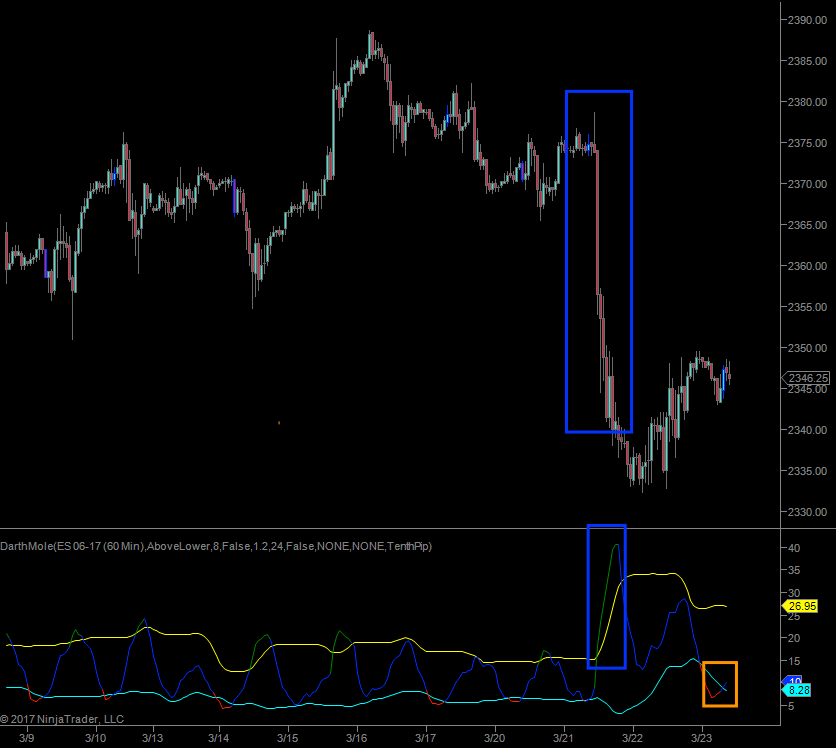
Volatility is a complementary aspect of tape reading I have introduced here on several occasions. I see value in observing it as it gives me additional clues as to what to expect in the near time future (not three weeks out). For example after a sudden spike in realized volatility (blue squares) it was clear that the E-mini would most likely settle into a trading range of some sort. You can see clear evidence of the ‘barbed wire’ type of tape Scott often mentions in his posts.
Right now we have reached the lower range of the RV scale and I would expect an increase in RV again once we cross over. Now realized volatility can rise in sideways tape as well, let’s not forget that! But the current configuration on the 60min chart suggests that a break out of the range has the highest probability. This is not a bad spot for a long position if we drop back down a little (RTV-L type of setup) or a short position if we breach the lows and then paint a retest. If any of those scenarios happen I’ll be all over them like a fat kid on a Mars bar.
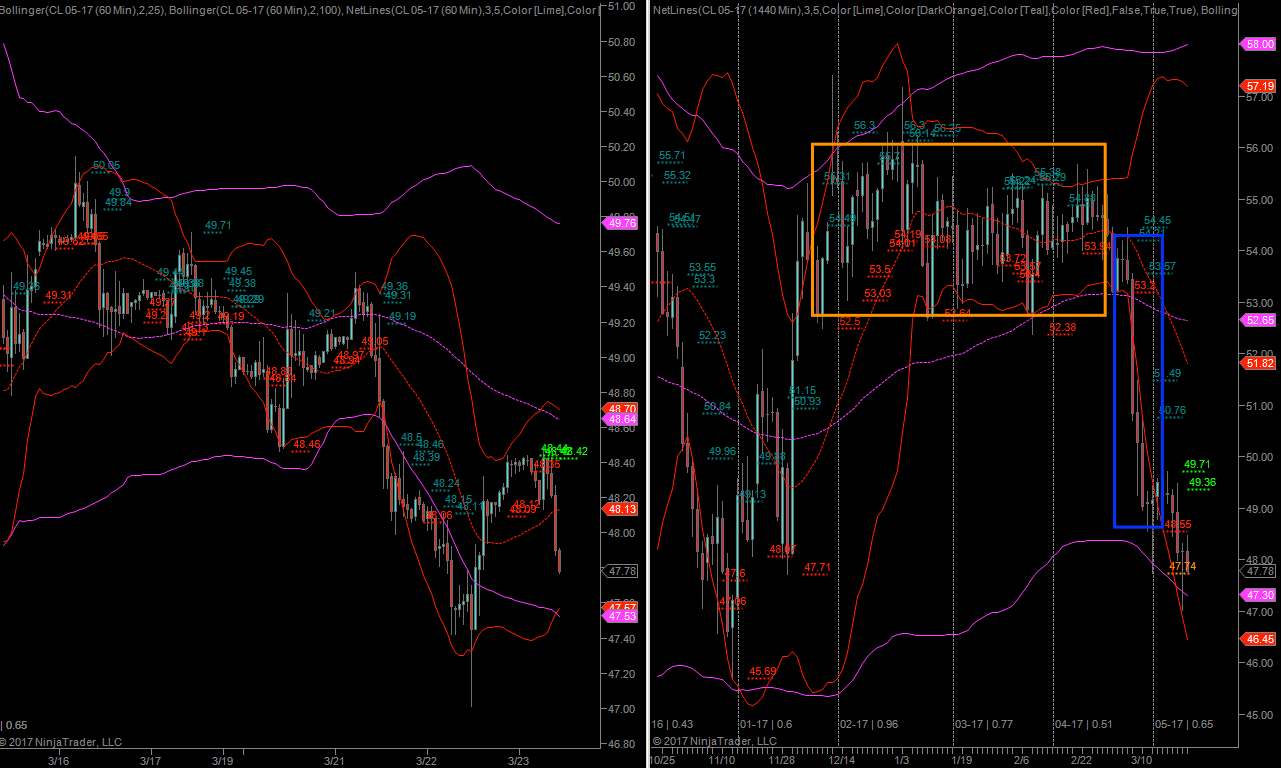
Crude is another great example of distinct market phases. Just look at the sideways mess during the Feb and March contracts. I told you back then to not touch this one with a ten foot pole and I was right. Of course once the range was breached (without magic outside candles – LOL) the longs got burned into submission.
Currently there are tepid signs of a possible floor but once again we have very little evidence. The lower 100-day SMA hasn’t been touched in months and I don’t see any other context that would give me an excuse to engage in either a long or short position. And if in doubt just say no.
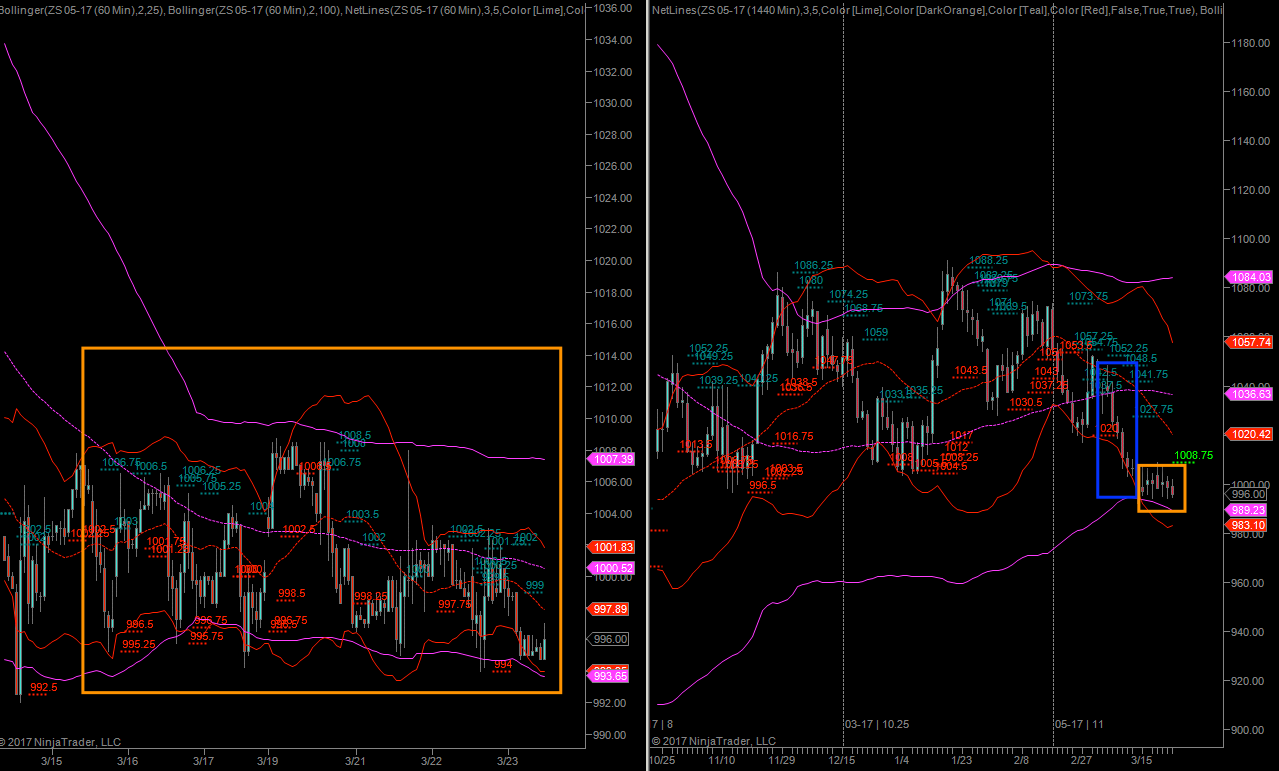
Soybean is a great example of a sideways range (orange) after a brief trending period (blue). I think you are starting to appreciate the pattern now, which incidentally is particularly pronounced on futures contract – even more so than in equities. The hourly panel here however shows us a Bollinger compression which suggests the possibility of a new trending phase in the near future. And frankly it wouldn’t matter if you’re using a 100/25 BB or a 200/50 or an 80/21. Whatever your lens is the range compression on the hourly panel is real.
The timing of course is the tricky part as usual. One approach I follow in these particular situations is to simply engage in small short term campaigns after a secondary hourly spike low (or 90m or 120m – it doesn’t matter) has been painted. A secondary spike low is one that is distinctly higher than the recent one. After entry I put a stop below the lower spike low and then burn some incense to appease the market gods
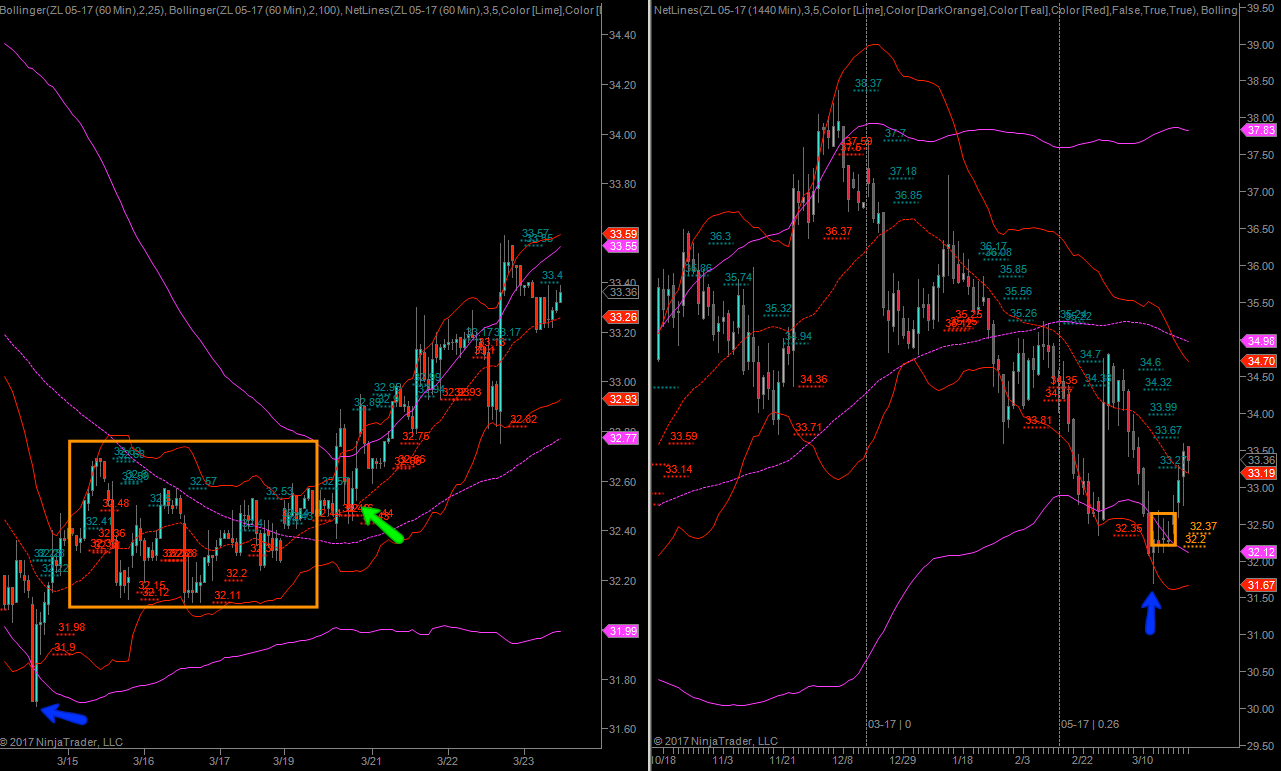
Soybean Oil shows us an example of how to trade a possible major spike low on the daily. First up I usually wait for a bounce followed by a drop. Had I been around I probably would have proposed a long entry on either 3/15, 3/16, or 3/17. Once again the stop would have been below the major spike low, which goes without saying.
Had I missed out on those then I probably would have waited for a BB breach followed by a retest. I acquired this approach from the type of entry techniques the Richard Dennis and the rest of the turtles used back in the 1980s. To be clear Richard would have entered on the breach of the upper Donchian (similar measure) without a drop back down. That may have worked well back then but these days you get a retest in over 50% of the cases and your odds of success at that stage are pretty high. Again, something we should be plotting in the future.
Alright but I kept the best for last. But if you want to see it then it’s time to pay the Mole (to quote Scott) – I’m not running a charity here!

It's not too late - learn how to consistently trade without worrying about the news, the clickbait, the daily drama and misinformation. If you are interested in becoming a subscriber then don't waste time and sign up here. The Zero indicator service also offers access to all Gold posts, so you actually get double the bang for your buck.
Please login or subscribe here to see the remainder of this post.


