Living Inside a Broken Clock – Tuesday, Dec. 1, 2009
Living Inside a Broken Clock – Tuesday, Dec. 1, 2009
The blogosphere is attempting to mobilize sane people to contact their Senators and reject Bernanke’s attempt at a second term. States are borrowing money to pay unemployment benefits. Ordinary people are shunning credit cards and using cash this holiday period. Countries are debasing their currencies in an attempt to export their way out of economic malaise to the detriment of their neighbours. GOLD is benefiting as a haven from financial turbulence. Flagrant spendthrifts are being rewarded and savers beaten. Welcome to the Broken Clock, courtesy of the Evil Speculator and Mole’s considerate nature.
Yesterday was a fine expample of SPX putting another dainty toe into the cold waters that lead to the abyss, and promptly headed back to the beach to lie on a towel. As you can see in the chart below, the green dashed line once again shows itself to be heady support.
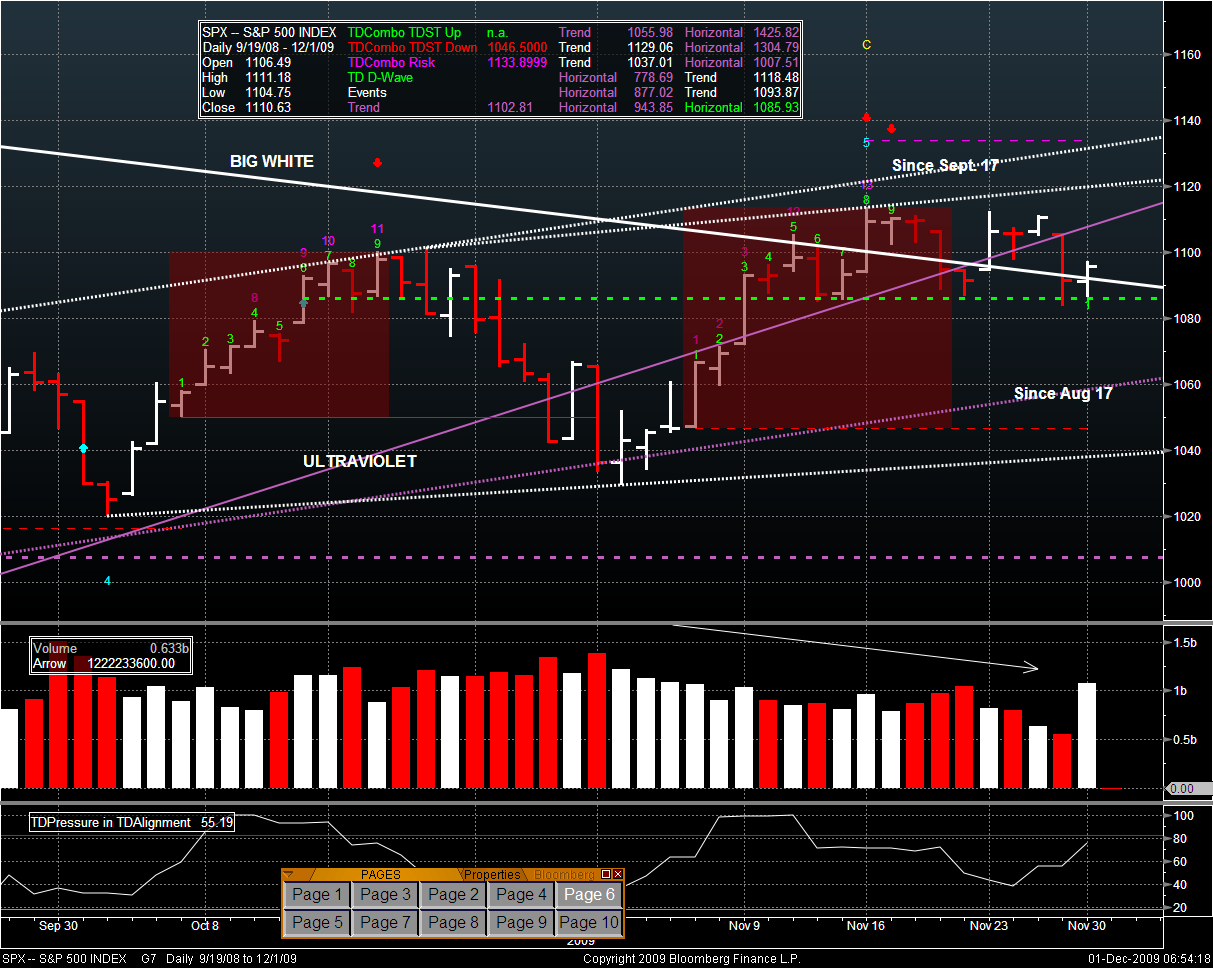
Volume was magnificent as another potential H&S pattern died with a whimper. Is this to be the fabled re-test of ULTRAVIOLET (the long term trend line from March 2009) or the first salvo in the run up to the often-mentioned SPX = 1122ish.
I believe that this market is tired. In spite of the volumes, the close was only up about 4 points. Liquidity surged yesterday – but I would hazard that Equities are not the beneficiary that they once were. Given the pummelling on the USD, the price of Gold, today could likely be another up day for SPX as fears about Dubai and other possible cockroaches have already faded.
This still walks, talks, and quacks like Distribution. I wouldn’t go short myself (except on an intra-day scalp). I want to see what happens if SPX does manage to re-test ULTRAVIOLET. I want to see what happens if SPX once again tries the dashed green line. I’ll give up 10 or 20 points to NOT be hoisted on my on petard.
EQUITY
The world is green. The DAX unabashedly so. The 5 day chart of the DAX shows that the march up has begun anew.

The DAX opened at 3AM from a lofty perch and pulled the ES up beside him. You can see that ES was wandering in the wilderness all night until that 3AM EST point. (The green, blue, yellow, and red picket fences are momentum and price exhaustion levels).
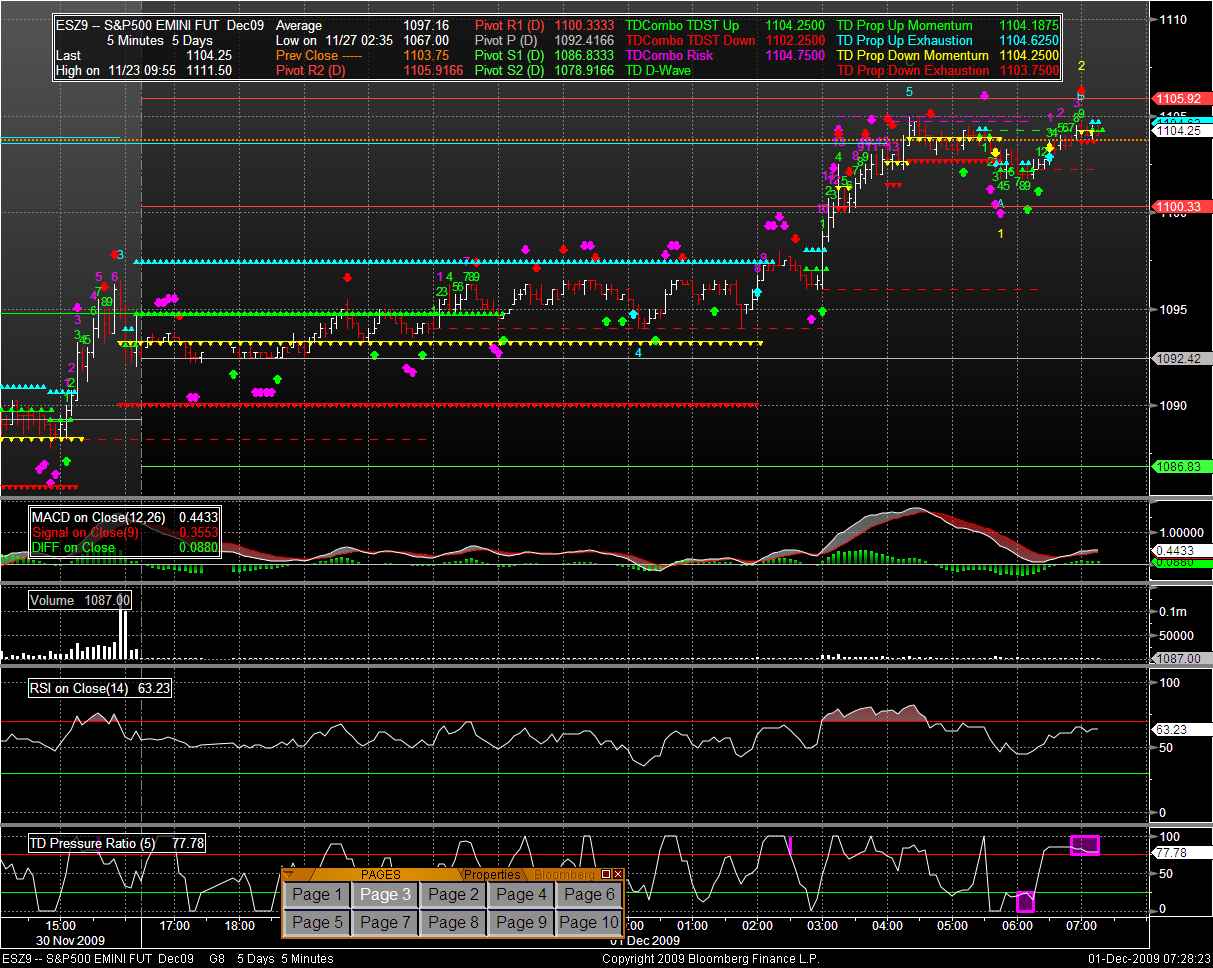
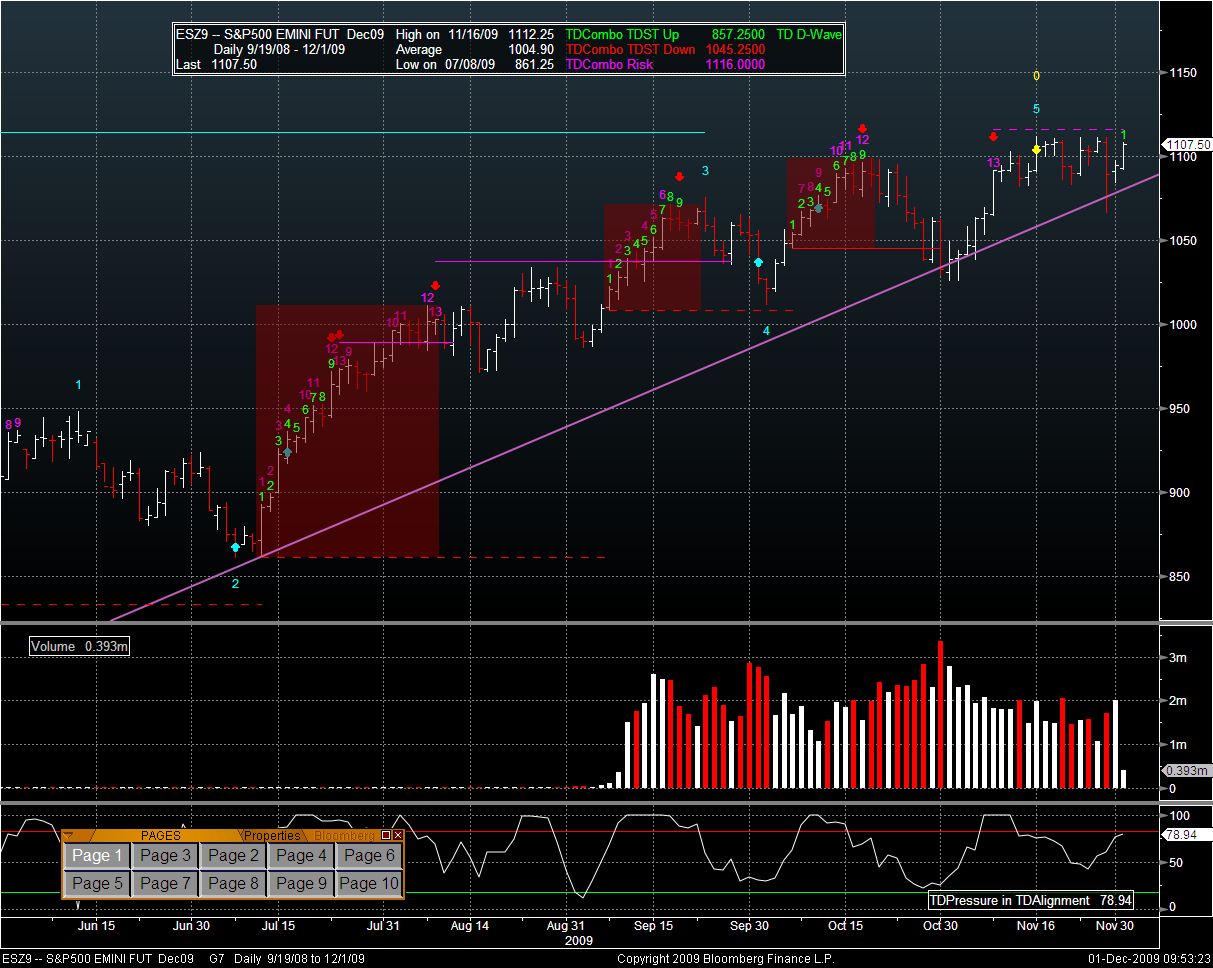
TD Pressure says ES is overbought on the short term and the important risk level below is the dashed red line at 1102.25. The magic number overhead is 1116. IF ES closes above that with a day or so, and opens higher the next day for another green day….. then the march up will have regained momentum. Pivots are:
- R2: 1106 = This was support on Nov 25 (last WED) before the gap down on Thanksgiving. I’ve got the closing level at around 1108 – and ES is almost there.
- R1: 1100.50 = This was the resistance area yesterday early AM. Europe opened and ES went through it like a hot knife through butter
- Neutral: 1092.50 = Acted as a floor, on and off, early yesterday and overnight. Seems like solid support
- S1: 1086.75 = Support level from yesterday. Point of the gap down on Thursday post-lockdown.
- S2: 1079 = was resistance in the move up off the bottom on Friday. Now, would likely be support.
FX
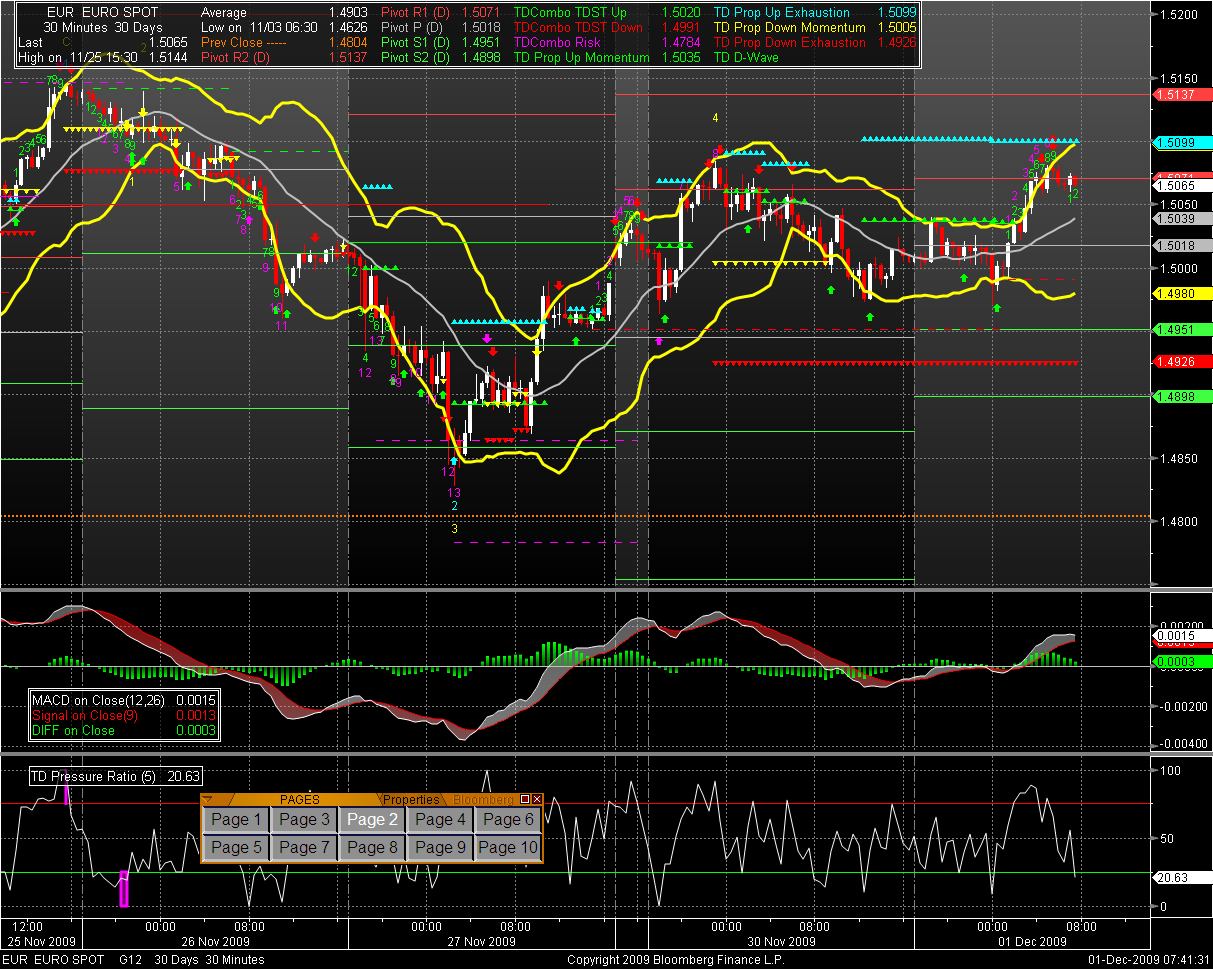
If you didn’t see it, the AUD is on a tear after rates were hiked another 25 bps. This was expected – but the reaction in the USD and JPY are way beyond what anyone thought would happen. European data from this AM were better than expected and that put a bid under the EUR – even though selling came in at current levels (1.5070ish)
USD is the world’s bitch, once again. CAD, EUR, and GBP are all up strongly. JPY is weaker – but for Pete’s sake, it’s below 0.87. Isn’t anyone wondering why Japan isn’t trying to Jawbone the YEN down? It looks like the EUR has been climbing steps all night from its low at midnight EST. Sort of a measured ramp and camp as direction is muted around the pivot at 1.5071; I think that 1.51 has become a sort of psychological barrier. It has not yet breached the last high of 1.5084 – which I have NO CLUE what that could mean. This is likely just a breathing pause on the way up the mountain again.
DXY is floating in no-man’s land in between two support pivots. It looks like the market is trying to decide whether to head for a new low or crawl along the bottom at this level. If the correlation holds with SPX, it suggests that there is a lot of indecision in equities.
NEWS
European data was stronger than expected. Australia raised rates. China continues to grow. Dubai risk fades. Japanese companies might go on a buying spree as Yen is strong.
DATA
Lots of sales and price data.
I suspect that yesterday and today are setting the table for yet more distribution and rotation from one asset class to another. Just remember that prop trading for GS was a losing proposition until Bernanke and Geithner’s new financial world order of FRNs for everyone. I’m waiting. In spite of the USD drop (again), the equity markets still look tired – yesterday’s volume notwithstanding. The Cialis is wearing off.
Cheers.
UPDATE 9:54 AM EST
Here is the daily ES chart with a simple trend line from the low in March 2009. Can anyone look at that chart and NOT see that the market is tired?. The purple dashed line above the highs represents a TD risk level that indicates supply waiting to come into the market (in theory). It is at ES = 1116. ES is being pushed into the nose of a wedge. Above 1116 – possibly a bull run and the end of distribution. Below the trend line – if not an underthrow – then a retrace that can only be confirmed as a bear move if it exceeds the lasat low at ES= 1026.