


Spoiler Alert: There Is No Magic Indicator
Spoiler Alert: There Is No Magic Indicator
If you are using any modern trading platform such as ThinkOrSwim, TastyWorks, TradeStation, Etrade, Charles Schwab, Multicharts or NinjaTrader, they come loaded with HUNDREDS of built in indicators.
Great example: I love trading on ThinkOrSwim a.k.a. TOS, but it probably is the biggest offender when it comes to luring in retail traders with literally 1000s of useless indicators.
In fact there are so many indicators in any of these platforms that even a veteran traders such as myself would have WTF moments trying to sort through even half of them.
Spoiler alert: there is no magic indicator
There you go: I just saved you 100s of hours of wasted time, and possibly $1000s in losses back by avoiding trading systems that mainly rely on a bunch of indicators.
You’re welcome 😉
The reality with indicators is that ALL they do is to tell you information about the past.
The vast majority of them essentially have two inputs: price and volume.
You can do all kinds of fancy PhD math, but at the end of the day, with a few exceptions (that I had to build myself) all indicators are essentially based on price.
They are just multiplying, dividing and shuffling those prices in a different way.
Ergo: There is no magic trick when it comes to indicators.
The only information that really matters is knowing if a market is behaving in normal or abnormal ways.
And you don’t need graduate level calculus to figure that out.
In 99% of cases, the only metric that matters for trading are those based around probability. It’s ALL about probability.
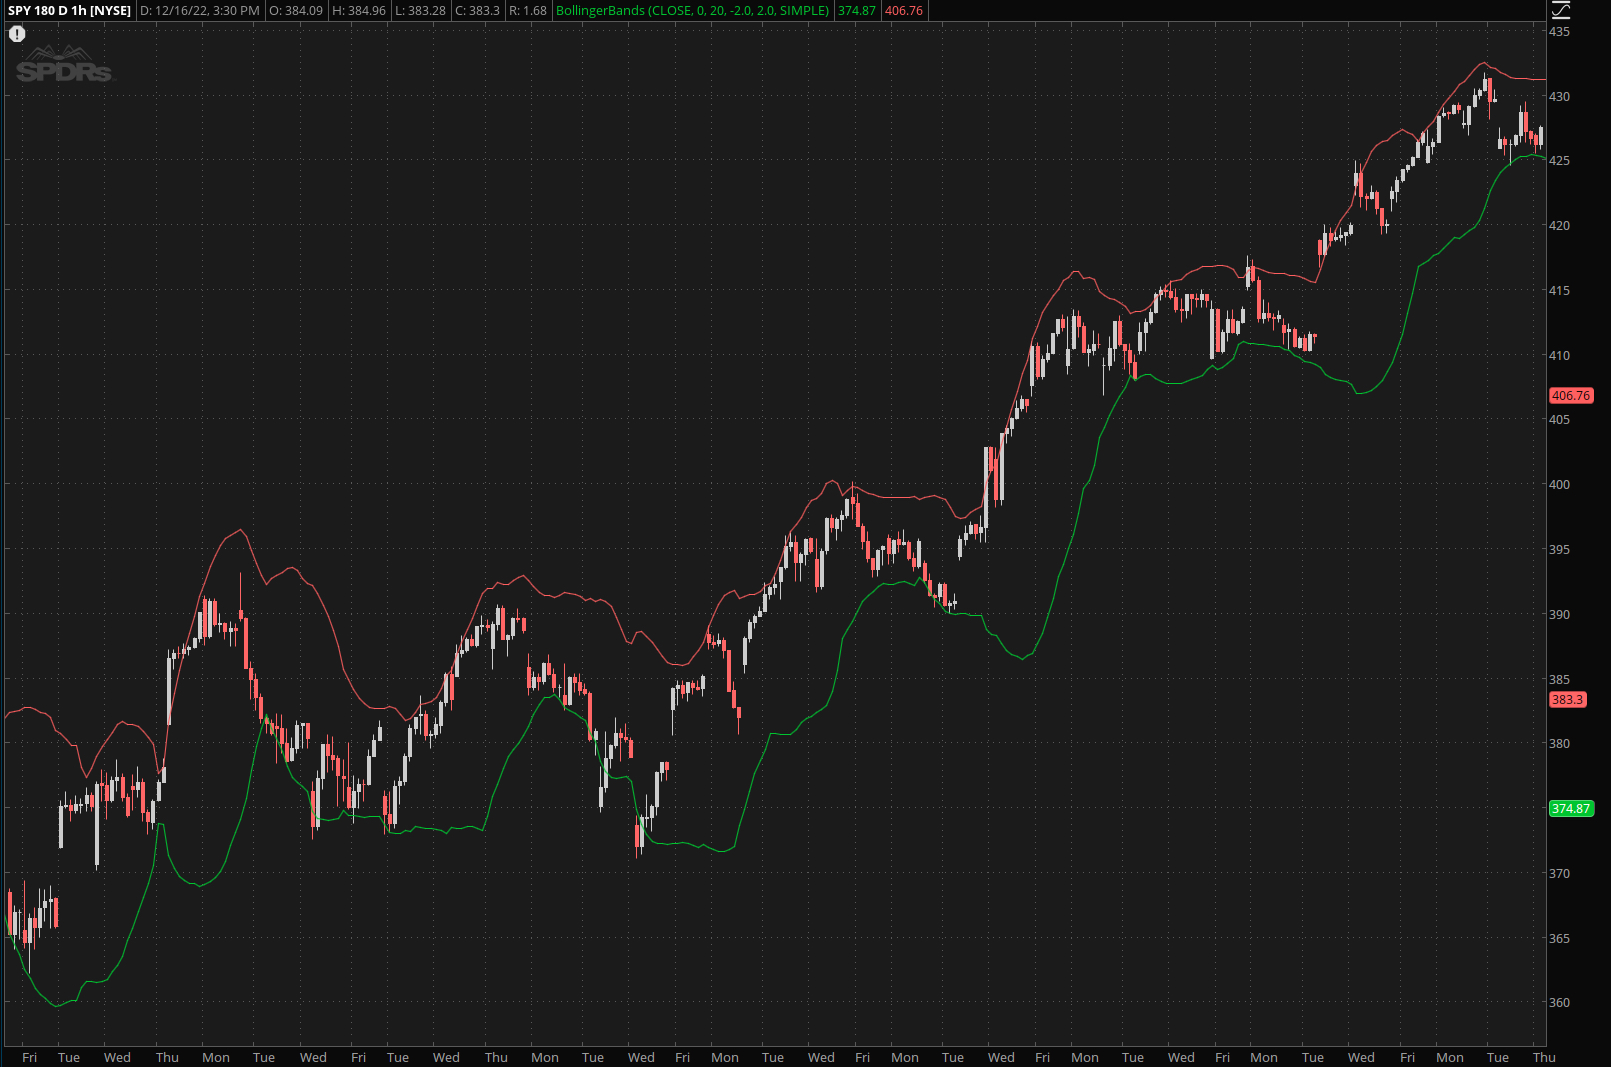
In most cases, good old standard deviation will get the job done. The simplest example of this are Bollinger Bands.
Almost all trading platforms have Bollinger Bands built-in and its basic premise is super simple.
Given the vanilla default setting common on most platforms it calculates a moving average of the last 20 candles (not shown on the chart above) and then surrounds those with a standard deviation, usually 2.0 standard deviations.
What does that mean?
If something is two standard deviations from the mean, that’s telling you that you’re observing something that only happens less than 5% of the time.
If this is in the proper context, this can be super powerful when you develop trading techniques that are based on probability.
And again, probability in trading is EVERYTHING.
Take advantage of our 2023 kick start super sale which offers a massive discount if you sign up for Red Pill Quants Unlimited for an entire year.
Not good enough for you?
Right now on this page ONLY you can lock in LIFETIME access.
That’s right, never pay us a single cent again and enjoy our premiere options trading service for the rest of your natural (or unnatural) life.
Awesome, right? But you can only get it on this page, so hop off that fence and lock in those savings while my temporary insanity lasts 😉
LIVE cumulative P&L of all my trades over the past year can be found here.
See you on the other side.


