


Timeless Charts
Timeless Charts
It’s crickets on the setup front, nothing salient on my momo charts either. Which means it’s time to relax, take a step back, and review the big picture across the board. Although point & figure charts seem a bit antiquated in this day and age I have never understood the negative opinion some traders hold against them. After all PnFs simply give us an opportunity to cancel out an inherent but sometimes deceptive aspect of your vanilla candle or line charts. And that is TIME.
Which means that you are free to ignore some of the aspects of PnFs you do not believe in, e.g. reversal patterns or price objectives. For me personally they have worked pretty well in the past, and IMO the trick lies in not considering price objectives as being chiseled in stone. Which by the way is why they call it a ‘price objective’ and not a ‘price target’ if you get my drift.
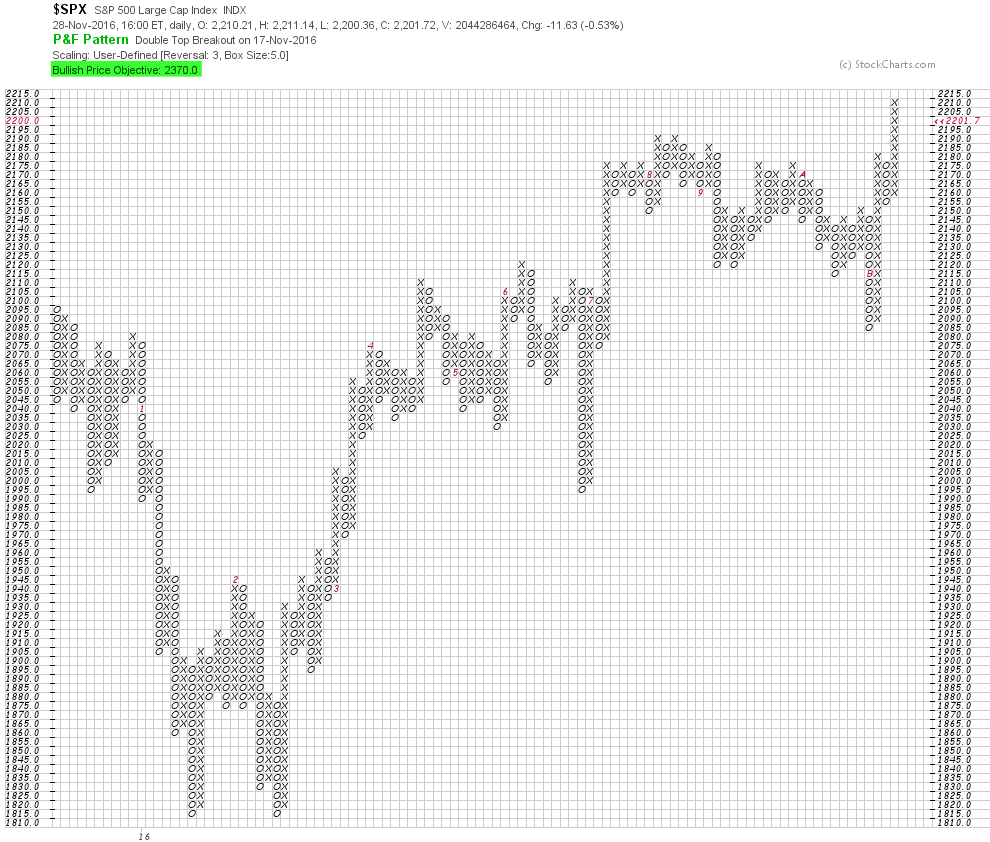
Shown above for example is a PnF of the S&P 500. What I see are discrete cycles of trending and sideways periods. As of right now we still seem to be completing the current trending phase, which most likely will be followed by a less entertaining sideways phase. Take note of the double top breakout on November 17th, which was followed by a continuation rally that’s just now slowing down. The price objective of 2370 doesn’t appear outlandish and there’s a pretty good chance we’ll get there by next March or April.
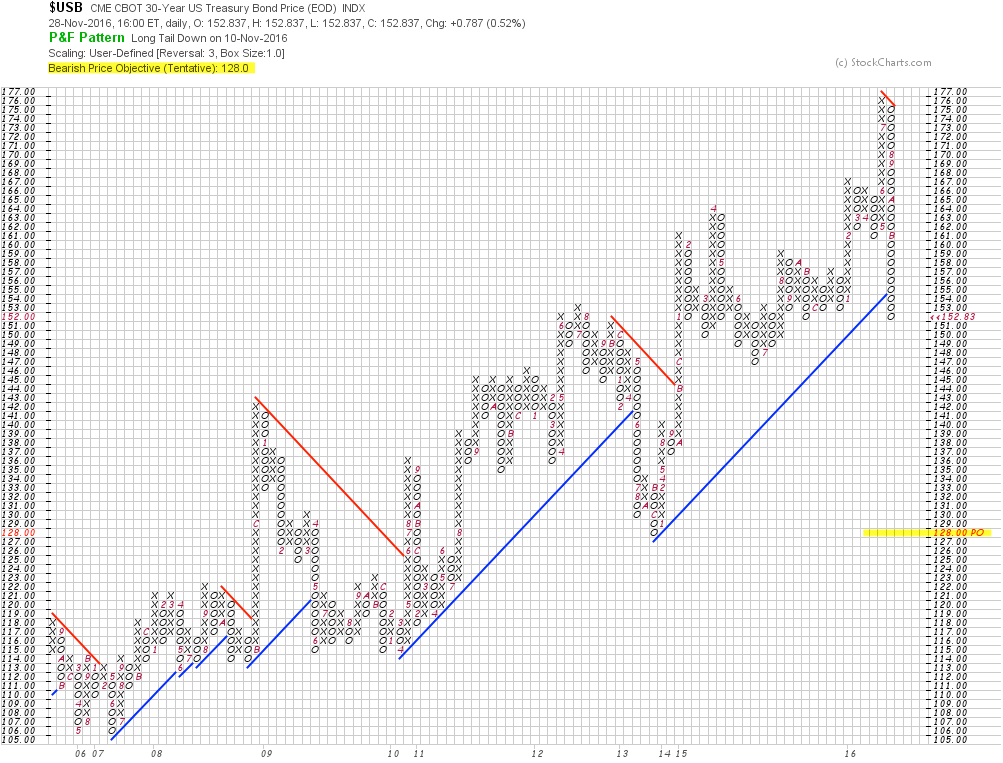
It’s a slaughterhouse over in the 30-year bonds and the current bearish price objective of 128 suggests that there’s no light at the end of the tunnel just yet. Ignore those trendlines which I find a bit silly, but you can clearly see similar patterns of trending and sideways action. Right now we are trending again – DOWN. I would not dare step below that falling sword and neither should you.

Running inversely are the treasury yields and our bullish PO is 4.4. Also note that we’re at the top of a falling channel and in particular that a breach of 3.25 would break the current LT trend to the downside. Which of course correlates pretty well with the formation on the 30y bonds earlier. Once that inflection point is breached I think we may see some fireworks in the bond markets.
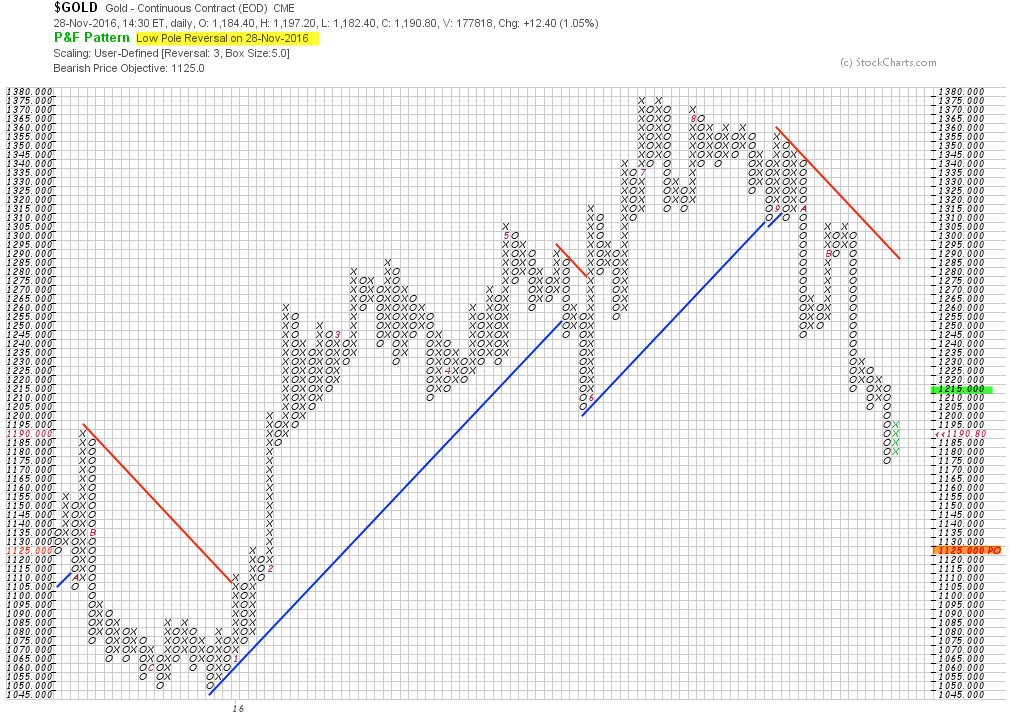
Gold couldn’t get a bid if it paid for it right now which confirms an earlier post of mine suggesting that the strengthening Dollar continues to impose gravity on what is already a pretty fickle and weak precious metals sector. The bullish inflection point here is 1215 and note that we actually triggered a low pole reversal yesterday. If that is breached we may see a quick pop higher but somehow I don’t think this is going to be a happy year for the gold bugs – again.
So let’s talk about the Dollar:

It's not too late - learn how to consistently trade without worrying about the news, the clickbait, the daily drama and misinformation. If you are interested in becoming a subscriber then don't waste time and sign up here. The Zero indicator service also offers access to all Gold posts, so you actually get double the bang for your buck.
Please login or subscribe here to see the remainder of this post.


