


We Got The Outlier
We Got The Outlier
We should probably preserve our final judgment until today’s close but I at this point I believe it’s fair to say that we most likely are looking at an outlier for week #40. Per the histogram, the SKEW, and standard deviation charts I posted on Monday we knew that there was a possibility for fireworks which made it possible for us to hedge ourselves appropriately.
One of our fellow evilspeculators quipped in the comment section that this was the last time he (or she?) would be listening to statistics and to that I can only counter that it’s important to properly understand the concepts involved. At least when it comes to historical price action statistics are mostly limited to volatility and distribution.
And the culprit here are not statistics, mind you, it’s the fault of the input: Which is historical price action.
SAY WHAT?
In case your head just exploded, let me explain. Remember that hit TV show from the early 2000s called ’24’ with Kiefer Sutherland as ‘Jack Bauer’, a member of the Counter Terrorist Unit (CTU) based in Los Angeles?
Almost every episode there was some scene where his nerdy analyst Chloe would pull up some grainy video footage and ‘Jack’ would ask her to zoom in like 50x and then ‘enhance’ some license plate so that he could read the numbers? She presses a few buttons and voila! The jumbled mess turns into a perfectly clear image of the license plate.
Of course it was complete bullpucky – at best you can slightly sharpen and enhance digital images that are blurred and still contain a minimum threshold of pixels. You can’t take a 15×5 pixel block and magically somehow turn that into a legible license plate. Let me show you what I mean:
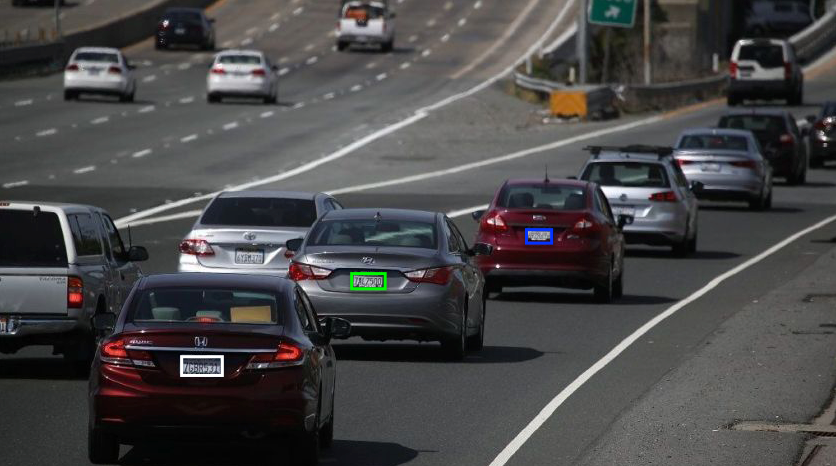
Let’s say you are poor Chloe and Jack Bauer is breathing down your neck asking you to do some image analysis. One in the first three cars shown in the picture above is jam packed with a politically correct chosen crew of irate terrorists hell bent on wreaking havoc somewhere at the L.A. convention center.
The tail has run cold and the only clue is the freeway cam pic right in front of you. Basically the fate of tens of thousands of hapless convention attendees is squarely in your hands. If you succeed then Jack gets to safe the day and everyone’s happy.

I have chosen the first three cars as good example of the challenge ahead. The first plate circled in white is pretty easy and although the B could easily be an 8 the numbers can be identified as 7GBR531.
The second one in green is actually not much further out but you’ll notice how much more degradation we are dealing with. Here’s a little trick: squint a little and and you’ll quickly see that it’s most likely 7AL7500. That squinting you just did is actually similar to a contrast algo we could perform with a modern image analysis program.
And yes nerds – I know there are a ton of heuristic and genetic algos we could throw at this task – especially in this day and age, but bear with me because I’m trying to make an important point here.
The last plate in blue is where things get pretty challenging – and that’s not even a tough example. Again a modern AI based system may be able to use a few thousand permutations and then spit out the most likely candidate. Not something that would have been easily accessible at the beginning of this century. But most likely we are SOL here and it’s high time now to clear out that convention center.
Crap In – Crap Out
When it comes to crunching numbers you can never extract more information than you put in. That’s a basic law of statistics and most people either misunderstand its general idea or are unaware of its implications. All you can do is to extract and enhance aspects of the supplied information you are interested in.
For example while you can calculate the standard deviation of all men in their 50s who are taller than 6′ you would not be able t to take the same dataset of age and height in order to extract how many people in the U.S. believe in the flat earth theory. You may laugh but that’s exactly what you are attempting to do when using statistics to predict future direction of price action.
Why? Because unlike volatility (see GARCH) the previous price return has no impact on the next price return. Of course there may be some price points across the entire data set that may have some predictive aspects (see chart patterns and support zones) but you have to first find them and then hope that they are not just based on temporary market conditions.
Which is probably why nobody, even the smartest Russian quants tucked away in the basements of institutional trading firms, have been able to crack this nut despite decades of trying to do so.
Signal To Noise Ratio
Another important concept in statistics is the signal to noise ratio (SNR) which is the measure used in general science and engineering that compares the level of a desired signal to the level of background noise. Let’s say you just received a transmission on your ham radio (yes I’m dating myself here) and it’s very distorted – most likely it’s because the SNR is very low.
And it just so happens that financial price data inherently is extremely noisy, which makes it very difficult to pick out any clues at to what may or may not constitute a predictive data point. On the other hand an increase in noise has shown to suggests that there will be even more noise, which we define as price volatility. At least that’s what the data shows at this point and it’s a view generally agreed upon by most quant traders.
If you are further interested in this subject I recommend an old classic on the topic by Burton G. Malkiel called ‘A Random Walk Down Wall Street’. Admittedly some of it is a bit dated but it does a great job of demonstrating how futile it is for traders to focus primarily on the least predictive aspects of financial price action.
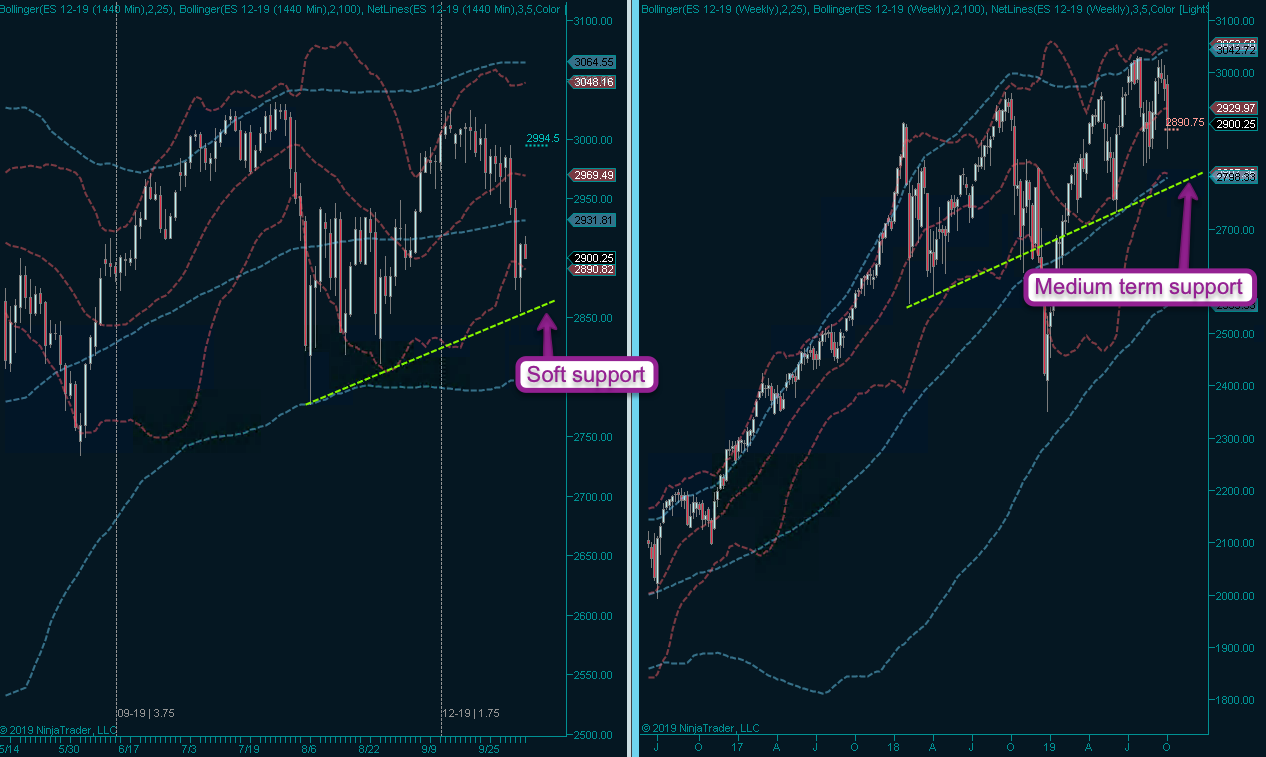
Now back to the bread & butter stuff: Yesterday’s exhaustion spike has produced possible soft support near ES 2875 – plus minus. There is a much more credible support range near the 2800 mark, however technically speaking a breach below ES 2800 may trigger a massive slide, so even if we get there I would need to see a decisive floor pattern.

It's not too late - learn how to consistently trade without worrying about the news, the clickbait, the daily drama and misinformation. If you are interested in becoming a subscriber then don't waste time and sign up here. The Zero indicator service also offers access to all Gold posts, so you actually get double the bang for your buck.
Please login or subscribe here to see the remainder of this post.


