


Living Inside a Broken Clock: Friday, Jan. 8, 2010
Living Inside a Broken Clock: Friday, Jan. 8, 2010
by gmak
First blood is drawn as an employee goes ballistic with hard feelings over what happened to the company pension. The FDIC FINALLY issues an interest rate risk advisory to its members. The NY Times talks about the growing frequency of “ruthless defaults” in an article titled “Walk Away From Your Mortgage!”. US apartment vacancy is at the highest level on record. Both Households and Private Businesses are deleveraging at the same time – a first in over 50 years (based on FED data). There is still more room for the Household [Net Worth / Income] ratio to fall based on the cyclical lows in the last secular bear market in the ’70s. Net Worth can fall, or Incomes can rise. Guess which it is likely to be. Emergency UC numbers now exceed regular unemployment claims.
The default rate on CRE has more than doubled (as of Q3) and this is likely to be the source of the next “too big to fail” financial crisis. Total CRE debt is about $3.5 TRILLION. Don’t underestimate the second barrel of Iceland indignation and refusal to pay, if it spreads to other countries.
If you want to feel sad and angry at the same time, read these soon-to-be classic quotes from the crisis.
http://financialnewsexpress.blogspot.com/2010/01/economic-crisis-quotations-2009.html
Welcome to the broken clock.
EQUITY
Every fiber of my being is screaming that tomorrow will be “sell the news” on the jobs report. The reindeer games have put such an expectation of a blow -away number in the markets. I would be leery of huge volatility as there may be BLS-gaming of the numbers. There will be selling into that pop. heh.
ES has gone above the nose of the wedge but it sure looks like SPX put in a double top today (see any 5 min chart of SPX). I suspect that it is desperate moves by desperate old men who are trying to squeeze that last bit of blood from the last turnip without rousing the beast.

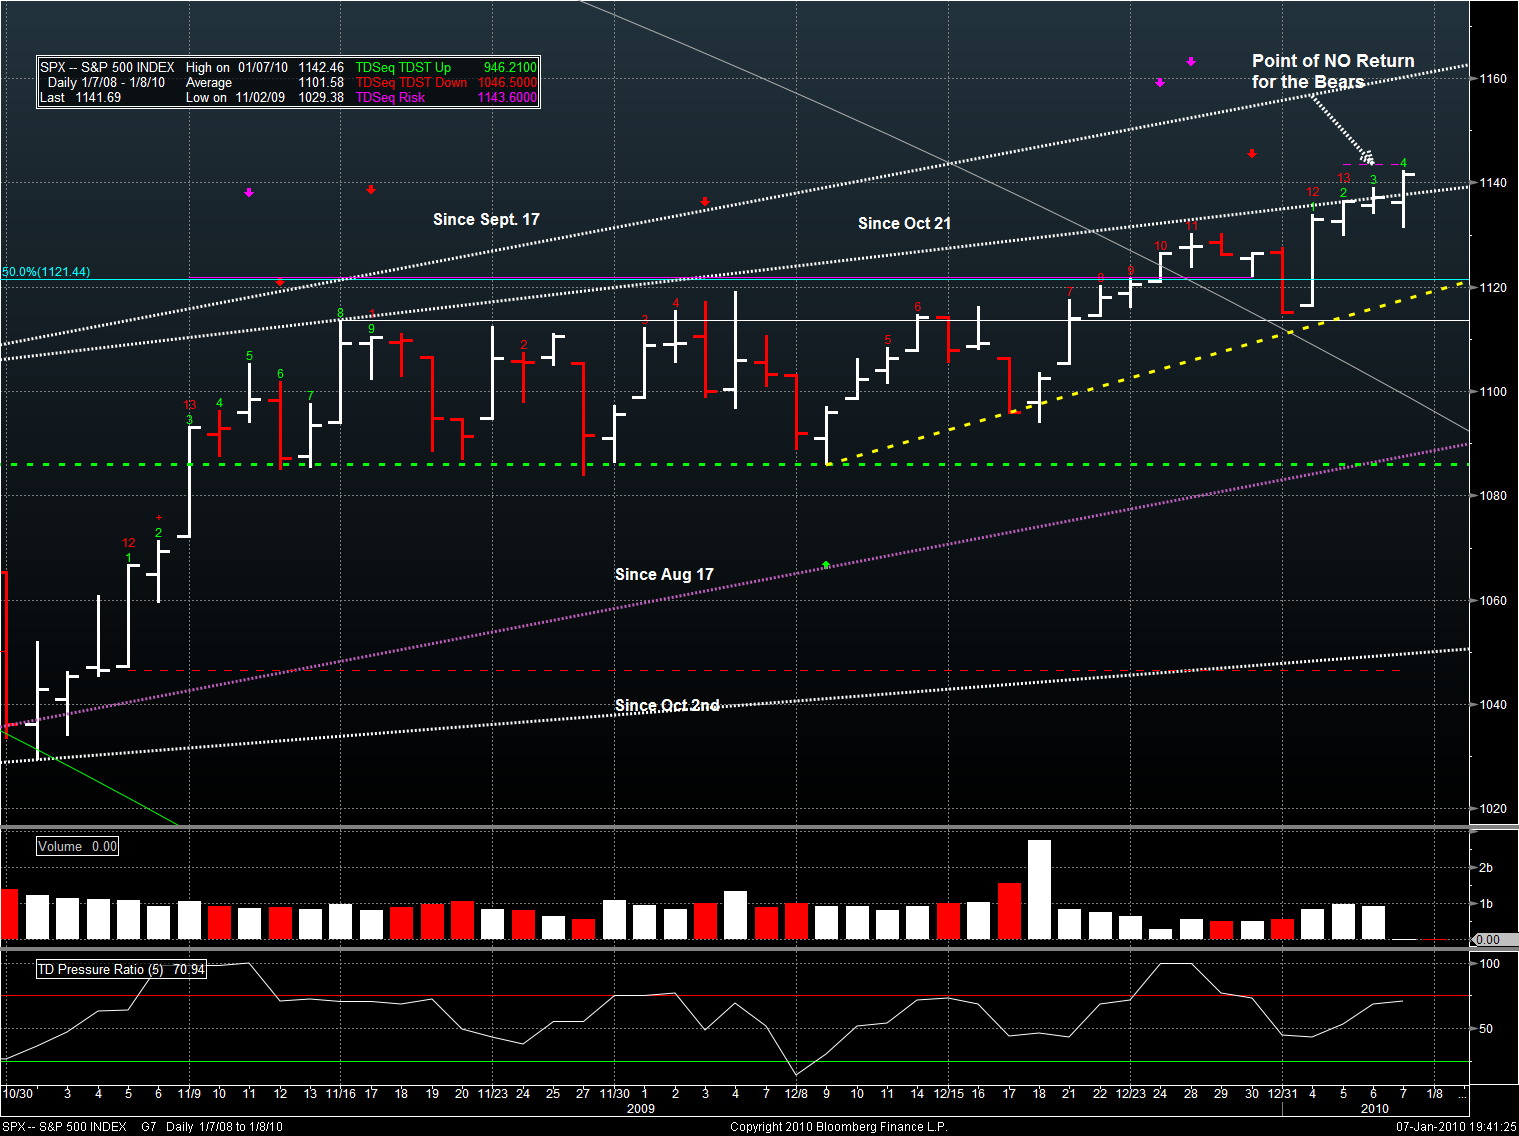
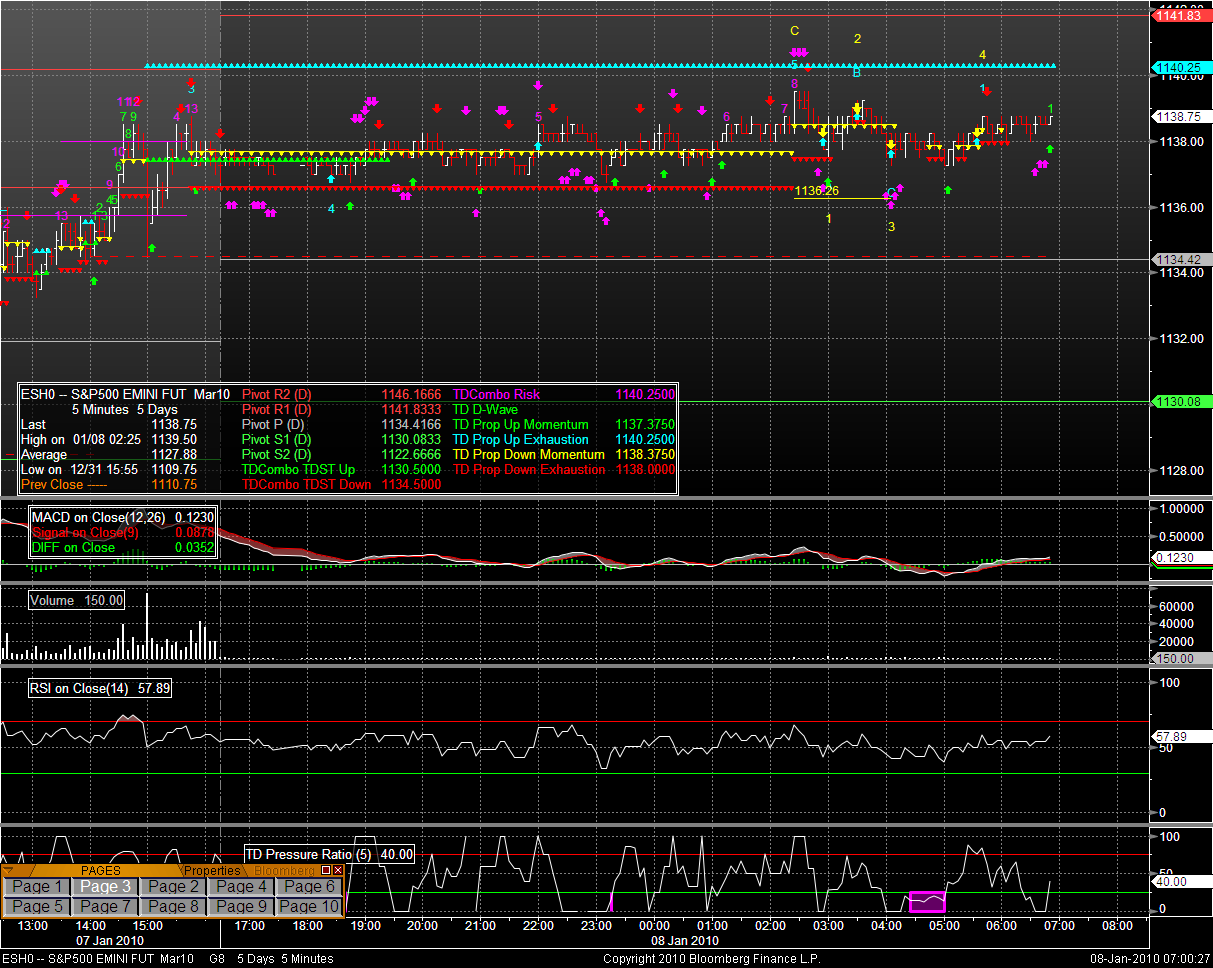
SPX is approaching the point of no return for the bulls. I think that getting above the 200 Weekly EMA at 1146 might be one of the final psychological nails in the proverbial coffin. TD says this is an important risk level as well – as indicated by the short dashed violet line that I’ve annotated on the chart. TD PRessure indicates that there could be more upside – although looking back at Dec 12/15 there is nothing that says the TD Pressure has to go above the red line before a retrace. Volume is low and lower volume has been an indicator of bullish tendencies. The SELL setup count is only at green 4 of 9 – so there is a ways to go before TD says there could be a sell of, but counts can be interrupted and starged over. Just look at all the bars previous without any green numbers. It is the red ’13’ on Jan 5 that interests me. This says that SPX should reverse direction within 12 bars, or it’s a false signal. Lots of promises in the TA.
The world is green except for Canada, Brazil, and India (plus a couple of smaller countries: Columbia and Israel). Why this is interesting is that ES has been tame all night. The DAX has been putting in a bullish flag off of a gap up at the open. No jump in ES. I would suggest that most possible good news from the jobs report is being anticipated in SPX already – and that after any initial spurts and dips, the direction should be down (“sell the news”). Meanwhile, the DAX is being led by financials = green shoot pumping, economic growth myth.
ES has me rubbing my eyes as it has been quite quiet all night. I think that there is a lot of nervousness over the jobs number and that a lot of money has already been committed – or the FED guy on the night shift needed a break. There will be confusion and volatility at 8:30 and my instinct says DOWN after that. Any trade will be put on after the spikes up and down, and be there with tight stops. Pivots:
- R2: 1146 = would be a new high. I wouldn’t be surprised to see an 8:30 spike come near this.
- R1: 1142 = would also be a new high. This will get hit, earlier IMO rather than later.
- Neutral: 1134.50 = This area was resistance Jan 6th and Jan 7 into the NY open. Looks like support now, and TD has a dashed red risk level around this area. If my thesis of heading down is correct, I would expect this pivot to get broken and then retested from below before resuming the trend down. i.e I’m looked for that dashed line to turn sold on my screen. That would be a lower risk time to go short.
- S1: 1130 = Looks like this area has been resistance on several days over the last week. I would expect some sort of bounce here in a normal market.
- S2: 1122.75 = This was a support area before the Jan 4 rocket launch that gave the SPX gap up at the open.
FX
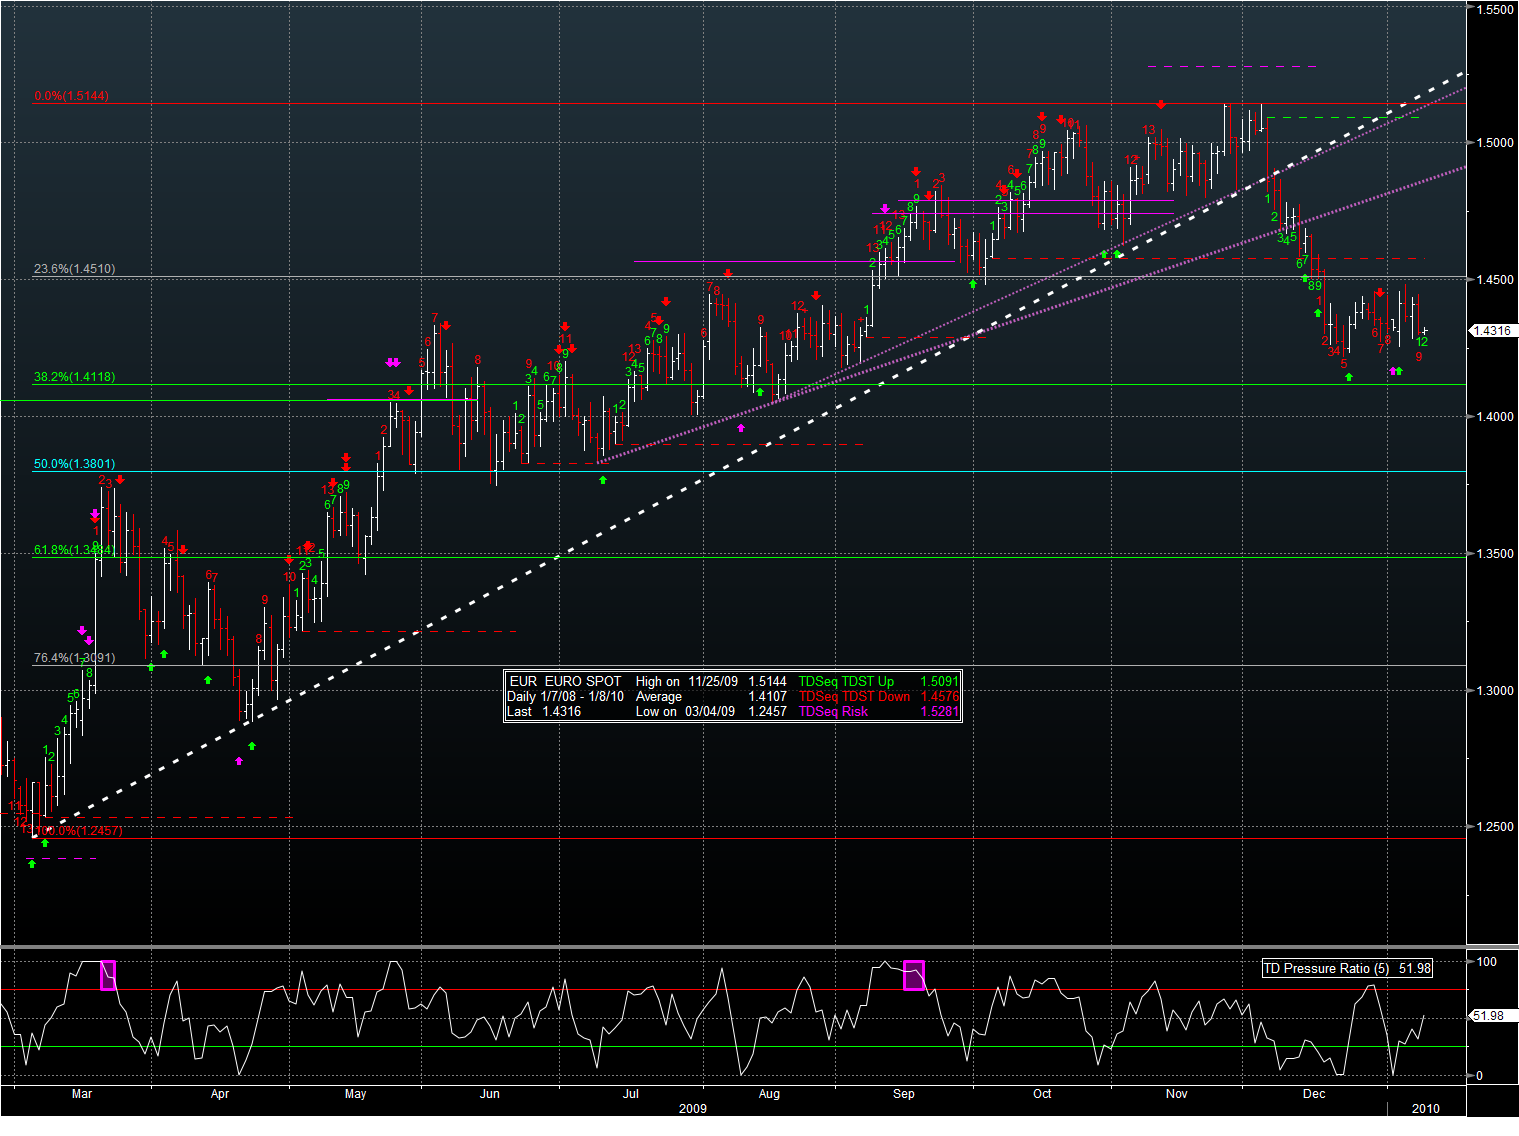
If any correlation is ever to hold true again, here is the EUR putting in a big oole bearish flag on the Daily chart. What else can I say about this? Trend lines have been broken on the wheel. TD Pressure is rising with a sideways movement in the EUR: bodes well for selling to come in. The flag is forming between two FIB lines and there is a dashed red TD line above just waiting for the retrace to send EUR spiralling down.
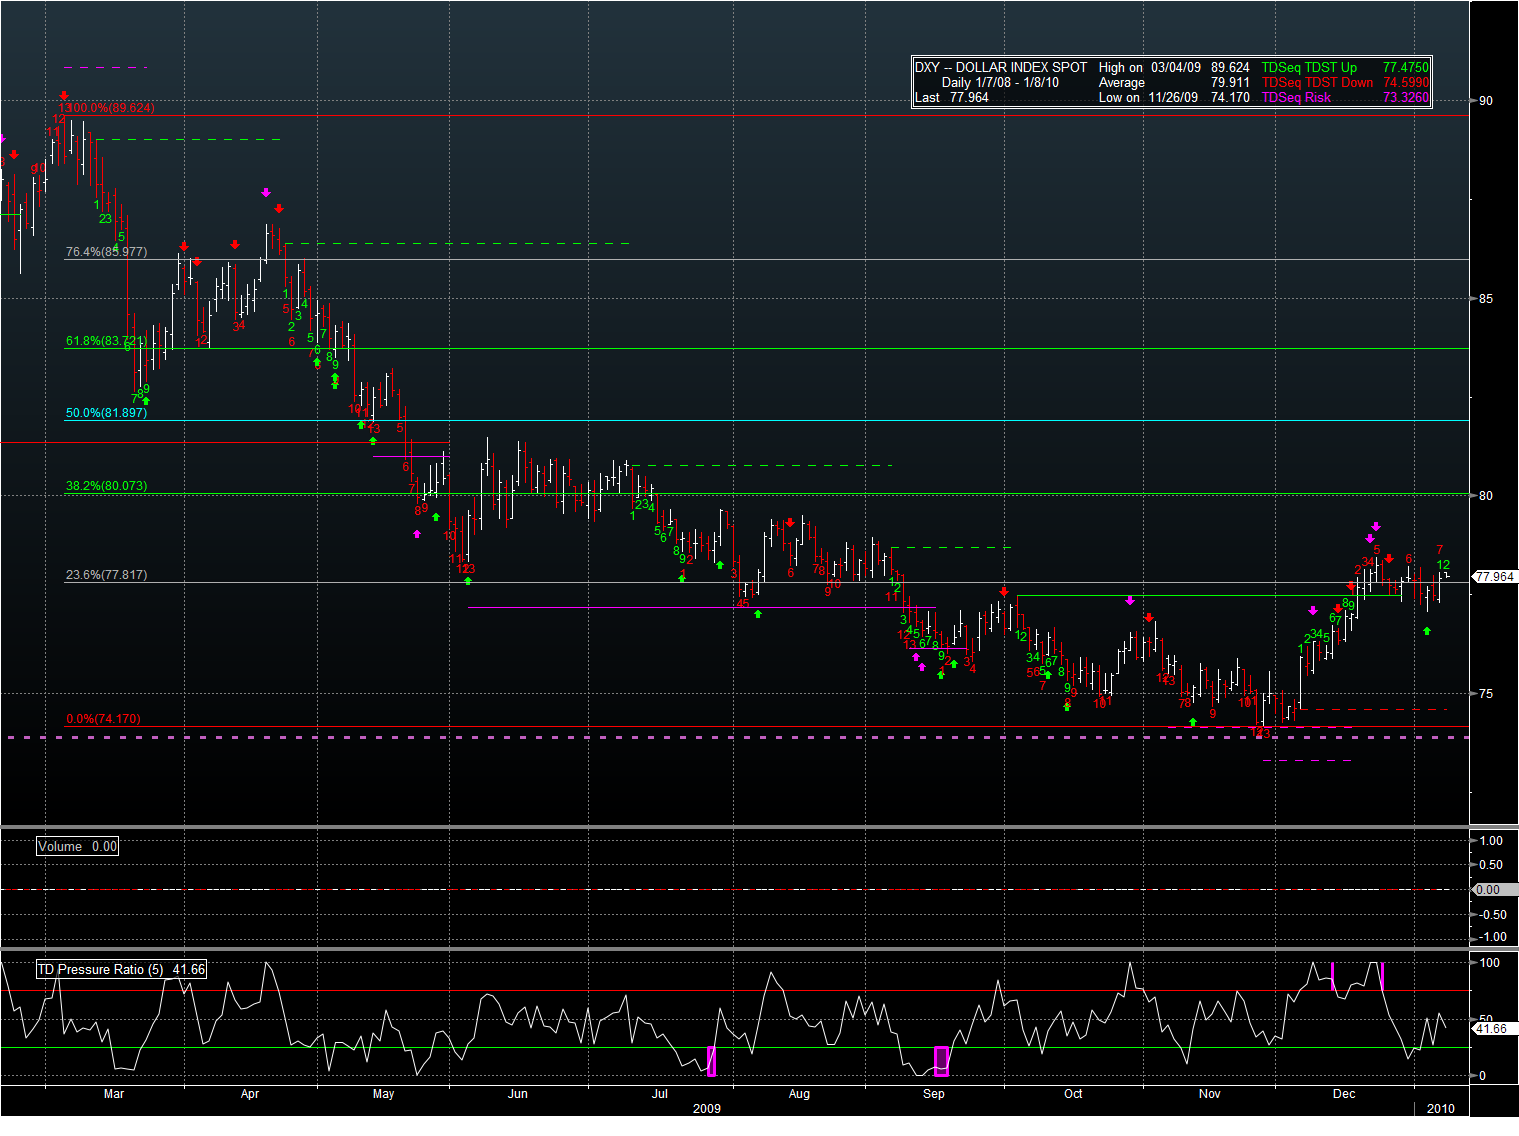
At the same time, DXY is clinging to life on the 23.8% pivot – and you know that has to be making a lot of USD bears nervous. The green line that started in October and ended at the end of December says that the upward trend will continue (It was dashed before) – and is effective technical support. The green arrow at the start of Jan 2010 says that TD Pressure needs to release up and provides a “Low Risk BUY” entry point with a stop at 76.71 – This only matters if the USD /SPX correlation will come back to -1 (DXY goes up, SPX goes down).
This AM, everything is close to flat except GBP which is stronger. CAD, EUR are weaker by a bit, and JPY is stronger by a bit. Except for the GBP thing, it looks like the move away from risk trade is back on – but how to explain the overnight results for the rest of world? The German trade balance was higher than expected. European unemployment was higher than expected. German industrial production was lower than expected. All in all, a mixed bag that says increased exports are likely coming from inventory (that’s one interpretation anyways).
I see that the DXY has failed to get above the last area of resistance (and highs) around 78.15 – ish. EUR continues to put in a sloppy bearish flag with a staff / pole of about 100 bps – which suggests a downside of around 1.40- ish if it breaks in the traditional way. I do so like tradition.
NEWS
DATA
Summary
There are a million reasons for this market to fall, and only one for it to go up. I don’t think that the move up is done – simply because those desperate greedy old men still have ample fuel to keep feeding the fire. In the shorter, trade-able term, I believe that the data at 8:30 will lead to weakness in ES because the market is at a level that suggests exceptional news. However, there were no games overnight. If there are stellar results, at some point the Birth Death numbers will be pushed into the sunlight and, I believe, there will be a retrace of any move up in SPX. I Will NOT trade this blindly – but look for high reward /low risk entry points where I can see a defined point that would tell me if my thesis is wrong.
Cheers.


