


Ancient Trading Concepts
Ancient Trading Concepts
I didn’t feel particularly inspired to post a market update today, so let’s mix things up a little and talk about trend trading. I wager that you’re familiar with the careers of world renowned trend traders like Ed Seykota, Tom Basso, Richard Dennis, or Bruce Kovner, which means you probably understand the basic paradigm behind ‘buying high and selling low’.
It’s a concept that runs exactly orthogonal to our core human instincts, which of course are to buy as low as possible and to short the market right before it’s about to fall off the plate. Not that there is anything wrong with the basic premise – however I really don’t think I yet again have to elaborate on why a chronic contrarian perspective is not only deeply flawed but in the vast majority of cases leads to devastated trading accounts.

Another name you’ve probably heard of is Richard Donchian. This handsome fellow happens to be credited with being the father of trend following. In fact Donchian’s original technical trading system became the foundation upon which later trend followers would build their own systems. Where do you think the famed Turtle system evolved from?
“Okay, thanks for the history lesson, Mole – but how valid are trend trading concepts in today’s fast paced HFT driven market?”
Well as with all things in trading you’ll be the judge! I for one find them extremely helpful when it comes to separating trending phases from everything else. You may recall that as a professor emeritus of mathematics at MIT Benoit Mandelbrot ran an extensive statistical analysis on the trending behavior of cotton futures, and he found out that 87% of all large price moves occurred in only 11% of the time.
And although not every single market is the same in general markets spend the vast majority of their time in clearly defined ranges until they suddenly shoot higher or sometimes start free falling lower. This phenomenon is being observed on all intervals but is most pronounced on minute based and hourly charts.
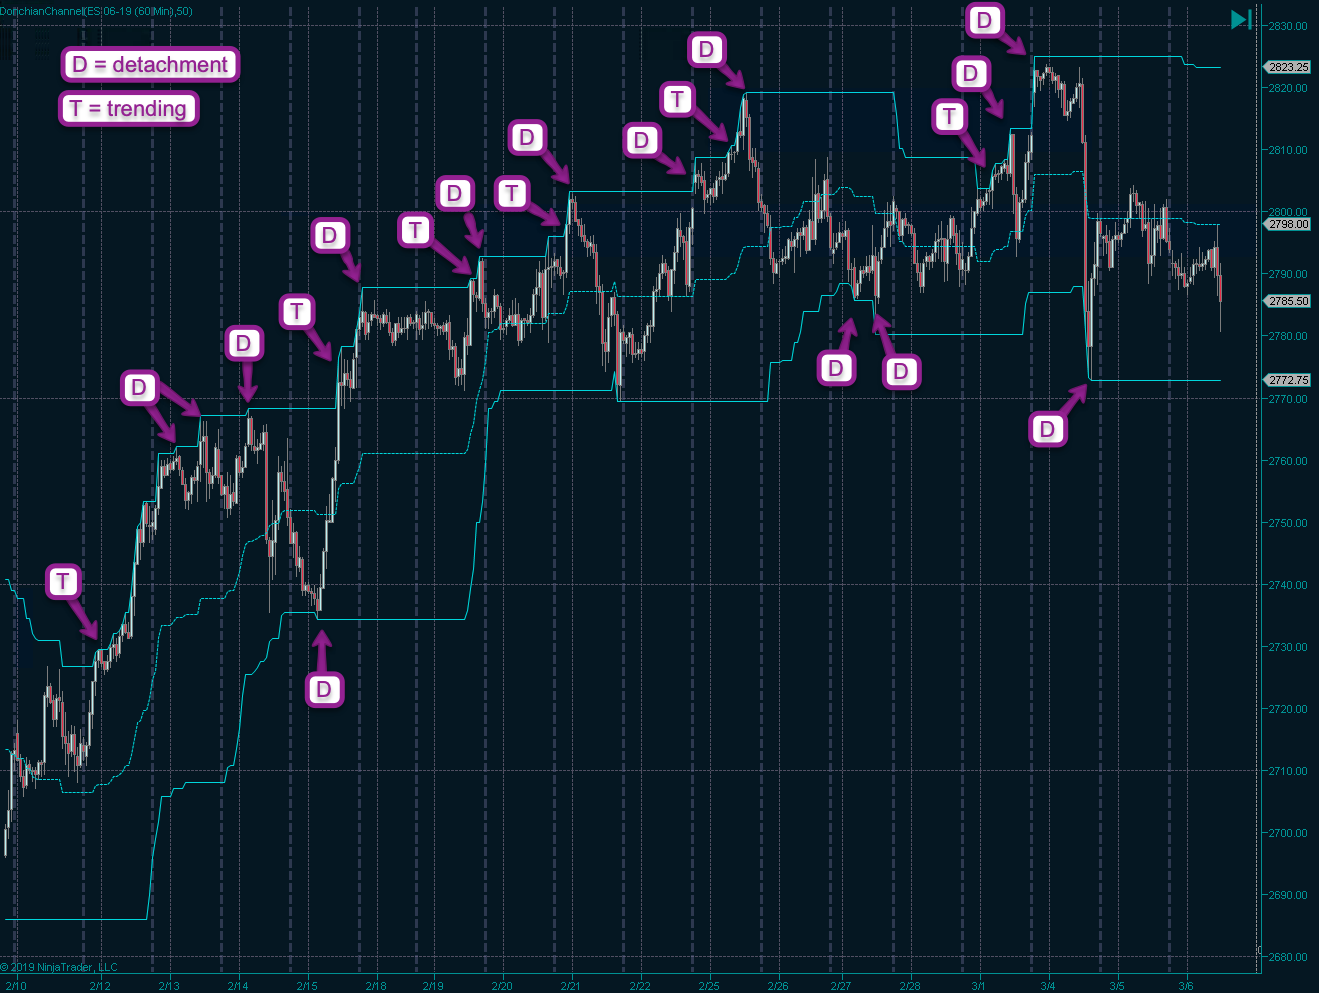
The indicator you are looking at above is, you guessed it, a Donchian Channel running against the E-Mini futures, which I’ve set to a range of 50 60-min candles. It’s probably one of the simplest price indicators one could imagine. The upper band marks the highest price of a security over N periods while the lower band marks the lowest price of a security over N periods.
The labels I’ve slapped on the chart point at two types of behavior – one is widely known as trend triggers and the other is one I’ve coined myself: detachment incidents – which refer specifically to a reversal after a period of consecutive Donchian band touches.
And what becomes immediately clear is that there are many Ds and very few Ts. I count only six Ts but 13 Ds – so the ratio is > 2:1, one again confirming that Mandelbrot’s findings regarding trending behavior hold up to this day and I don’t expect them to change anytime soon.
But back to the detachment incidents – does anything in particular stand out to you? Well, for one it seems to me that D incidents happen in the late stages of advances and are a precursor to an eventual reversal. Of course sometimes the market just turns on a dime without warning and that’s that.
But even then I see something worth nothing – when a market detaches from its upper Donchian without a retest it appears to be taking the express elevator to the other side. Fascinating!
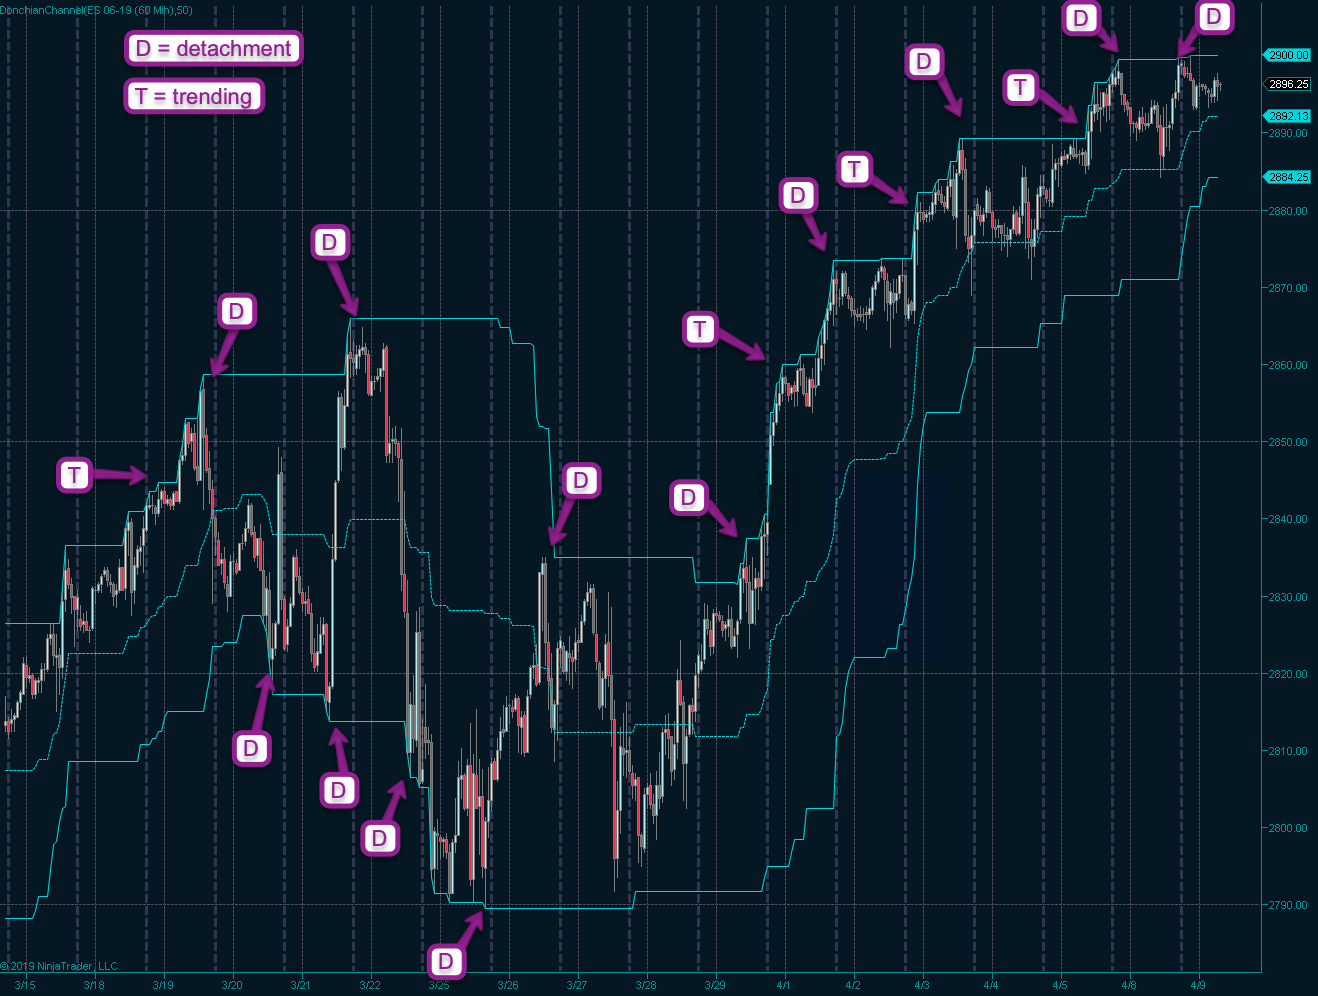
Here’s another example and it’s the E-Mini again all the way into yesterday’s close. Let’s do a quick count: Depending on how you label it we’ve got 12+ Ds and only 4 or 5 Ts (sometimes trending starts and is quickly reversed, so I’m uncertain how exactly to count it).
The same observations I made above seem to hold true here as well. Most recently we see a bit more trending action and quite obviously it makes the point that a market which continues to advance to new highs should never ever be shorted.
Also worth pointing out is the fact that a D quickly followed by a T also almost always leads higher albeit it’s usually accompanied by a bit more realized volatility. And if you see Ts taking turns with Ds followed by a shallow retest of the center line then the market is most likely engaged in a low volatility melt up.
You rarely see this behavior on the way down (which is a lot more violent). At least in equities that is, I should point out that LV declines happen quite a bit in the futures as well as to some extent in forex.
All of my observations above and many more tie directly into system rules that over time have defined core trend trading disciplines:
- Buy high.
- Sell low.
- Buy dips in an uptrend.
- Sell rallies in a downtrend.
- Trade what you see, not what you think.
- Read the charts, not the news.
- Set and forget you’re trades.
- Don’t try to pick tops or bottoms.
- Cut your losers short.
- Let your winners run.
- Keep a long term perspective.
- Stick to the plan.
Now this post isn’t supposed to be a soft sell for trend trading – my mere intent was to show how very simple concepts perceived as antiquated by some can still offer us great value. In terms of basic tape reading the ole’ Donchian channel has repeatedly delivered me valuable insights about the market’s two main modi operandi:
Trending (11%) and everything else (89%).
While most traders are fanatic about picking tops and bottoms my main perspective has long been one of differentiating between trending and non-trending market phases. Which in turn has made a profoundly positive impact on my own discretionary trading results.
Ancient King In Your Palm
By the way since we’re on the topic of ‘ancient’ concepts and ideas, which admittedly was a bit tongue-in-cheek: Take a look at your mobile phone right now, right there on the top right. Unless your phone is older than 5 years you most likely see this strange symbol:

It’s of course the symbol for Bluetooth which is a short range wireless standard that has effectively become a standard worldwide. What you may not know is that it’s actually a bind-rune (a merger of two runes together) that spell out the initials of Harald Bluetooth.
If you’re curious about a long dead Danish king managed to get his initials onto a 21st century technology then read the whole story here.


