


Binding Implied Volatility
Binding Implied Volatility
In my Wednesday post I introduced the Z-Score and also explained how we use it for scoring implied volatility, making it the IVZ-Score. What I didn’t focus on much is why one would do such a thing in the first place, and the underlying purpose may not be immediately apparent to some. Now I already can sense your eyes glazing over plus it’s Friday, so I’ll promise to make this brief and actionable for non-nonsense traders mainly interesting in turning a buck.
As I’m a visual guy I always enjoy plotting things as opposed to just looking at a set of numbers. Since I understand basic algebra however an IVZ-Score of let’s say 1.5 does tell me quite a bit about how to interpret risk pricing of a particular asset.
Tony and I have run the numbers and do know how to shift our strategies should AAPL for example push to an IVZ-Score of 2.5 – or minus 2.5 (which obviously happens a lot more rarely). But what if it AAPL pushes all the way to an IVZ-Score of 4.2 – what does that mean to us?
Well, the stats actually suggest that anything beyond an IVZ-Score of 2 usually results in mean reversion before the EOW – under normal circumstances. Clearly it’s not something we saw during the February wipeout during which we saw wide swaths of symbols push into an IVZ-Score of 4 and above.
The Problem
The issue we are facing here is one of context – which is a common affliction when it comes to interpreting implied volatility. Statistically speaking what is the difference between an IVZ-Score of 3 and an IVZ-Score of 6? Should we try a mean reversion trade starting at 3 or at 4, or perhaps wait for 6 – should it ever arrive?
A Possible Solution
One of my intrepid readers and part time quant who calls himself ‘Bob The Horse’ sent me a sweet little mathematical nugget I decided to put to the test. The basic idea of his adjusted formula is to create a bound range between -100 and 100 which can be more easily interpreted as it aims to convey statistical probability.
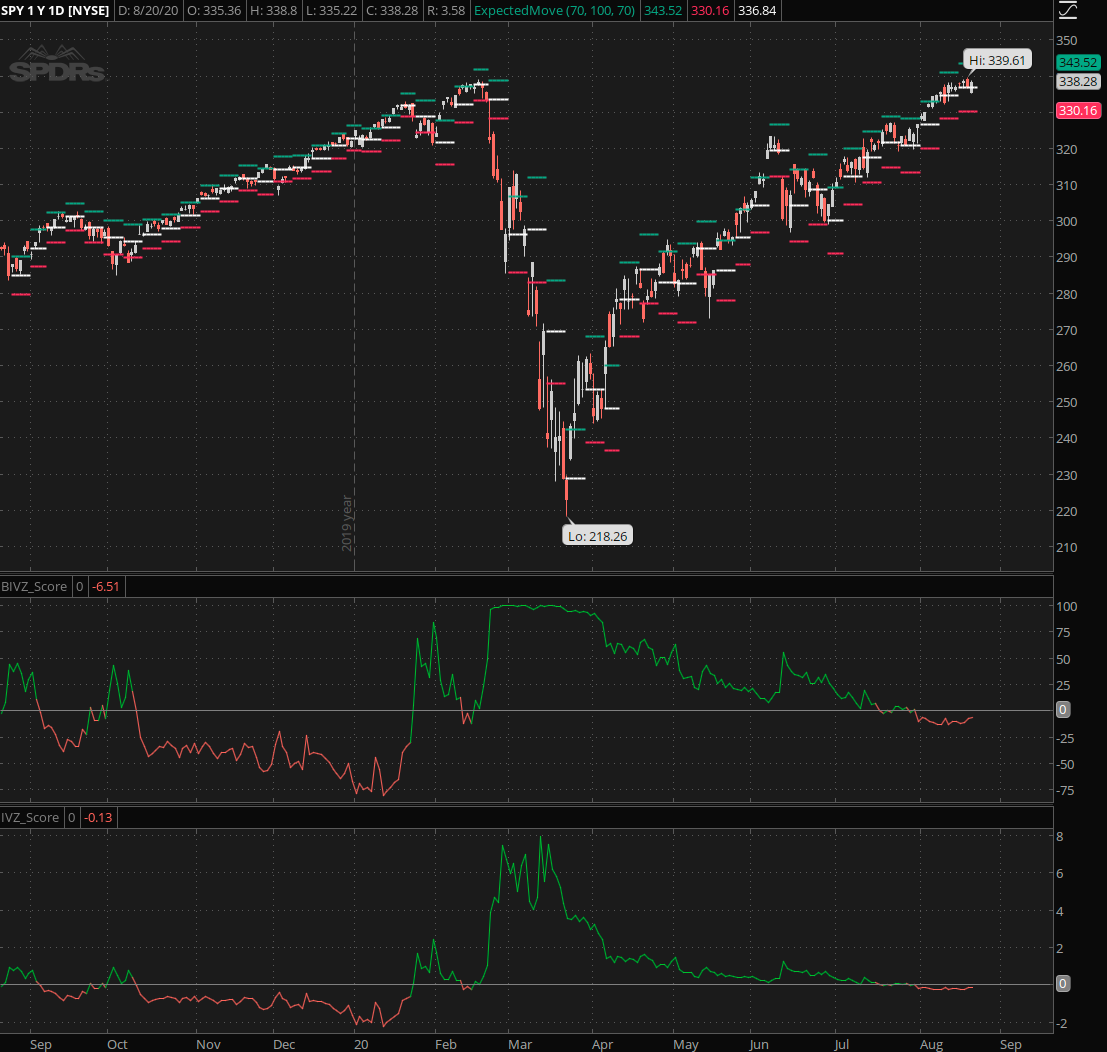
Before I share the formula let’s just look at both our good old vanilla IVZ-Score in the bottom panel in comparison with what henceforth shall be known as the BIVZ-Score in the middle panel – which either stands for ‘Bound IVZ-Score’ or ‘Bob’s IVZ-Score’ to honor its creator.
What immediately becomes apparent from plotting the signal is that there is not much difference between an IVZ-Score of +4 and +6. And that makes complete sense if we reflect on the fact that there never is such a thing as an ‘overbought’ or ‘oversold’ market. Like a stochastic or a MACD implied volatility seems to become ’embedded’ once it reaches a threshold of 90% or above.
This is a lesson I had to learn the hard way back as a fledgling trader and seeing it as a simple graph is hugely helpful, at least in my book. Now before we move on to a few more examples let’s take a look at the formula:

It's not too late - learn how to consistently trade without worrying about the news, the clickbait, the daily drama and misinformation. If you are interested in becoming a subscriber then don't waste time and sign up here. The Zero indicator service also offers access to all Gold posts, so you actually get double the bang for your buck.
Please login or subscribe here to see the remainder of this post.


