


Scoring Implied Volatility
Scoring Implied Volatility
The implied volatility Z-score is a way of framing implied volatility in context. For example, today SPY closed up 0.35%, which is decent but nothing compared with some of the candles over the past few months. But how normal or abnormal is it? We don’t know unless we’re able to put it in context.
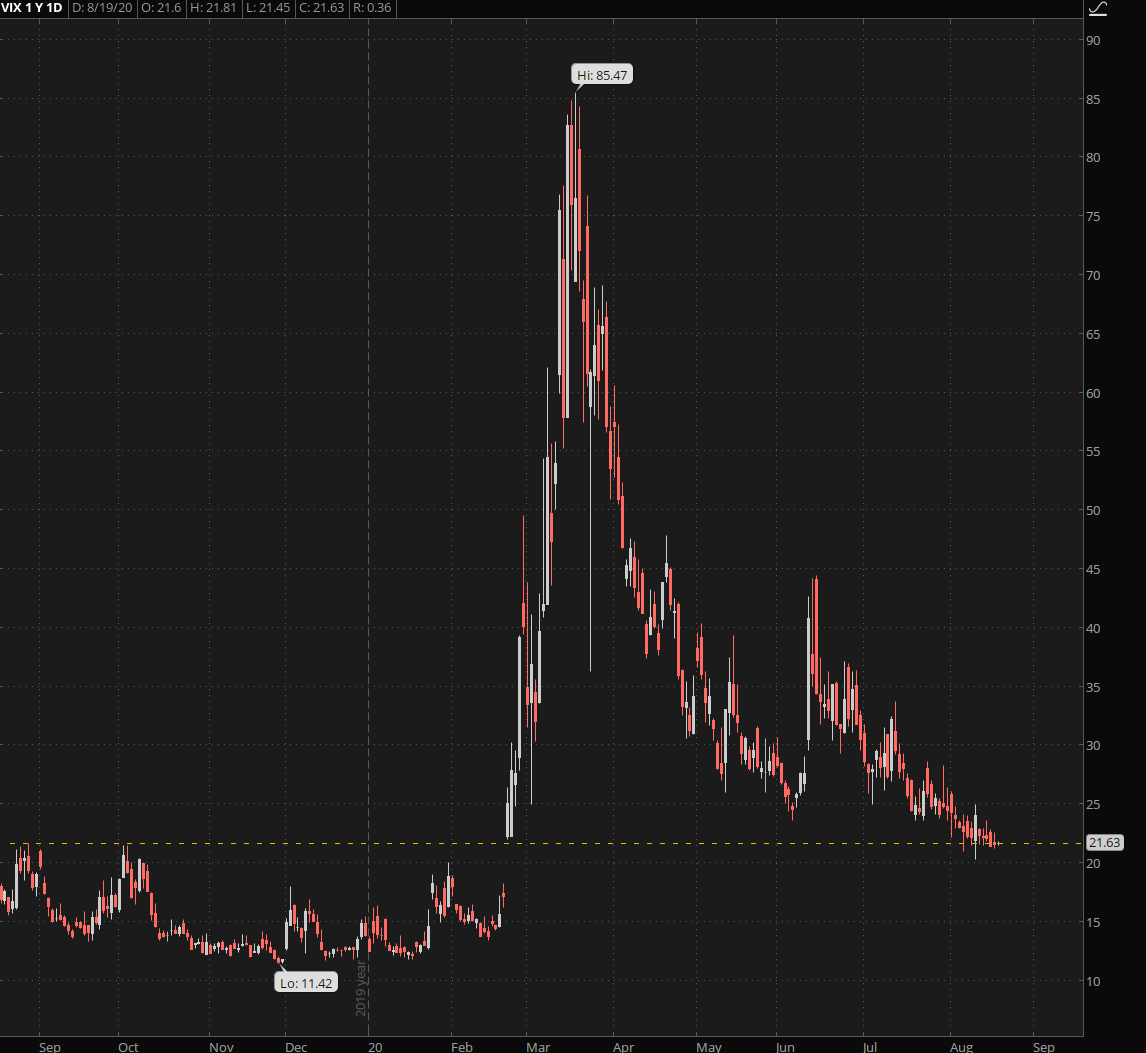
The current VIX hovers around 24, putting it well above the long run average of 14.7 (the line I drew is the current support line which also lines up with several spike highs in 2019).
So how do we measure how abnormal a value of 24 is? That’s what Z-scores do.
By the way this concept is discussed in much detail in the Options 101 course. Using IV Percentile or implied volatility percentile can be confusing as it differs between the TOS platform and the Tasty Trade platform. The IV Z-score uses the tried and true method of using a Z-Score to measure volatility.
Quick And Dirty Z-Score Refresher
If you’re new to Z-Scores, and have no idea what they mean, don’t be panic. Z-scores are super simple.
A Z-Score measures anything, rain levels, the number of people using outhouses at Burning Man per hour and the implied volatility of our favorite stocks. It works by measuring:
- Everything relative to the mean or average and…
- Measuring how far something is from the mean in standard deviations.
Sounds geeky? Yes, because it is. But once you use it, I’m confident you’ll be semi-pro with it in 5 minutes.
For example, let’s say we’re measuring how many people are using our favorite port-o-potty at Burning Man and discover on average it’s 30 people per hour.

At peak times, it’s up to 55 and during lulls at dawn, it’s only 5 people per hour. We do a bunch of number crunching and determine that the mean number of people using the port-o-potty is 30 people per hour with a standard deviation of +/- 10 people per hour.
The formula for computing a Z-score is super simple:
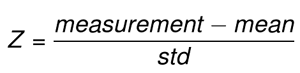
After we have our mean and the standard deviation, we can measure our data and give it Z-scores.
So if we stand there for five hours are count how many people per hour are using the port-o-potty, we can put the data in a Z-score context. After counting the people using our favorite bathroom away from home for five hours, our data looks like this.
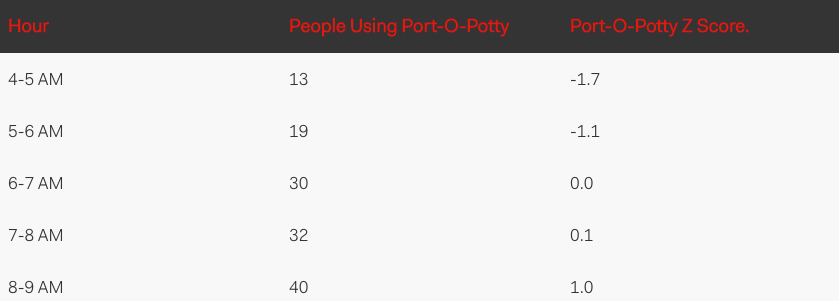
If we pick the first row, 13, we get a Z-Score of:
(13 – 30)/10 = -1.7
The Z-Score gives us context to our data. If we look at our 8-9am slot, we can see there are 40 people using our favorite desert throne. Is that a lot or a little? With a Z-score of 1.0, we can see that 40 people using it is a lot.
Likewise, at 4-5 AM, we see we have 13 people using the port-o-potty with a Z-score or -1.7. That tells us that is abnormally low. For a Z-score, a normal range is 0 +/- 1.0. Anything above or below that is abnormal.
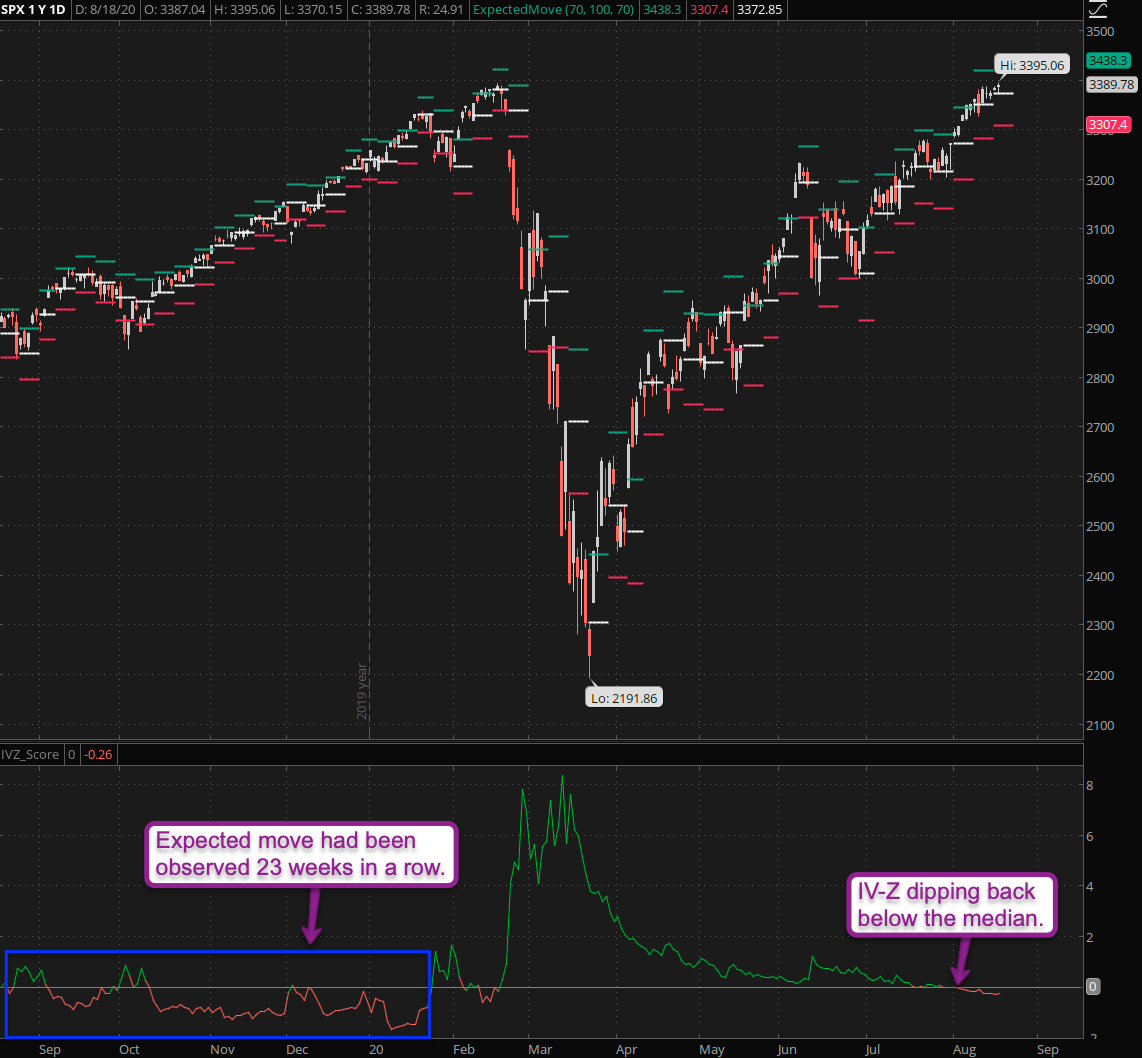
But enough about port-o-potties, let’s put our newly gained superpowers to the test. Shown above you’ll find the SPX on the top panel and the IV-Z score on the bottom. It’s very important to note that we are not looking at the Z-Score of the actual SPX here but the Z-Score of it’s implied volatility.
Subtle but important difference.
Implied volatility shows us directly (and not implicitly) how investors and traders perceive forward risk. Once again my wording is intentional in that implied volatility produced by some math geeks hidden away in Goldman Sachs’ basement – rather it’s a result of options being priced by active real world participants.
Note how the IVZ-Score remained below it’s long term median (near 0) throughout the latter part of 2019 during which expected move (once again based on implied volatility) was observed 23 weeks in a row.
Then suddenly all hell broke loose…

It's not too late - learn how to consistently trade without worrying about the news, the clickbait, the daily drama and misinformation. If you are interested in becoming a subscriber then don't waste time and sign up here. The Zero indicator service also offers access to all Gold posts, so you actually get double the bang for your buck.
Please login or subscribe here to see the remainder of this post.


