


Gold Clues
Gold Clues
I see a lot of conflicting opinions about gold recently and since nobody wants to talk (or think) about equities every single day I decided to do a post about it. And what I found in the process was rather interesting. In order to tell this tale let’s first look at the one instrument with which gold continues to ‘enjoy’ a close correlation:
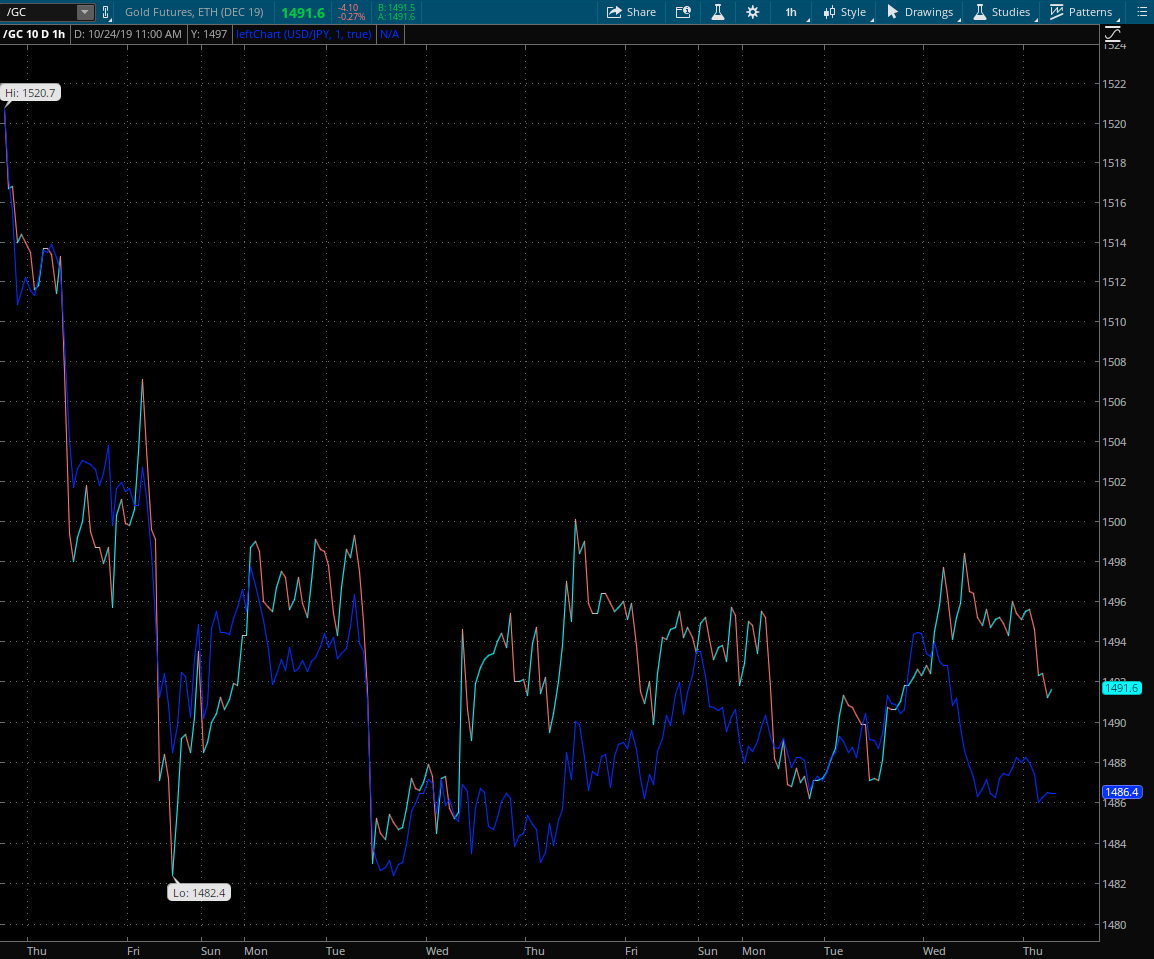
If you have been coming here for a while then you probably guessed it. It’s the Yen – depicted in the chart above as the inverted USD/JPY on top of the gold futures. We don’t really have to run a Co-integrated Augmented Dickey-Fuller (CADF) test to see that both instruments move pretty much in tandem.

And while gold is a much smaller market (and often harder to read) we are well served to pay attention to the various gyrations in the Yen. A rising USD/JPY practically means a falling Yen although there are times when a very weak or fast falling Dollar could give us a distorted reading.
Be this as it may, what I’m seeing on the hourly and daily chart is a break out attempt which is in the process of taking off but could easily revert for a final reset of the support zone clustered near 107.5.
However very few people who trade gold are really interested in the short term and are usually more focused on the long term picture as shiny stuff is considered a refuge of safety and value, particularly during economic turmoil.
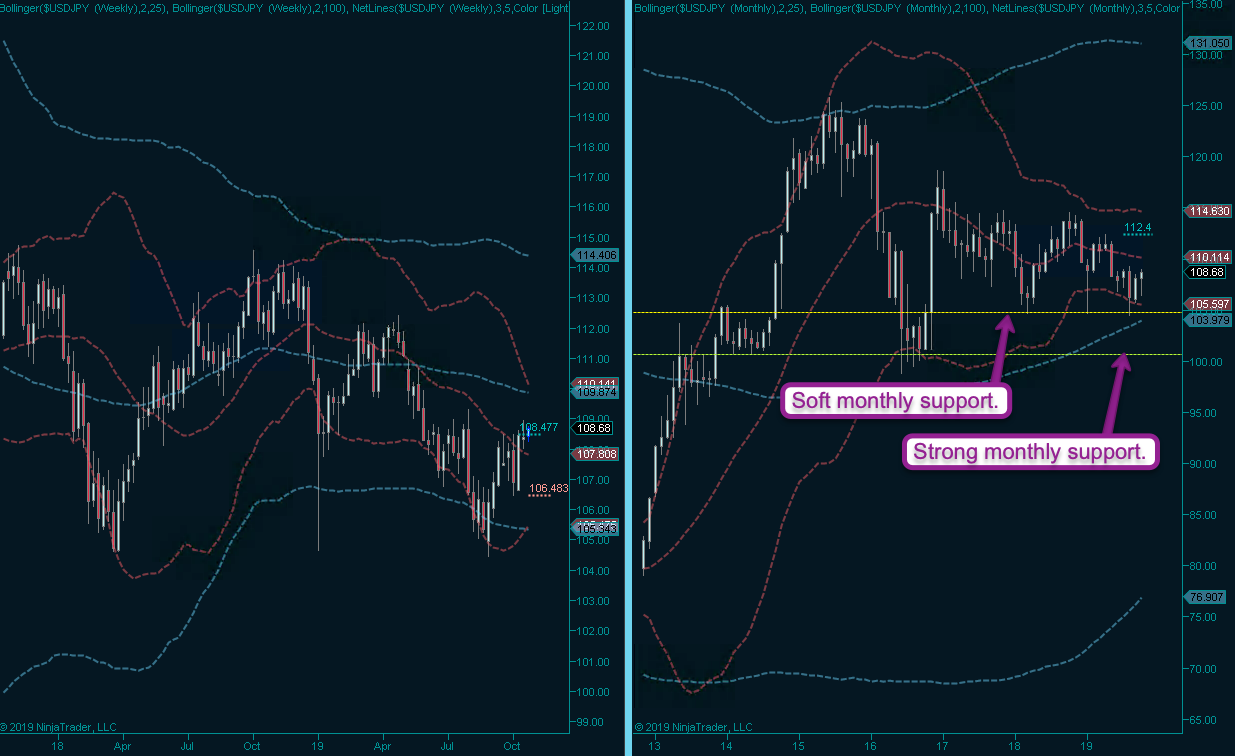
That also applies to the Yen to some extent, not that you’d know looking at it over the past few years, as it is looking a bit more mixed. In fact it’s been stuck in a sideways rut for over three years.
More relevant to our golden endeavors is the monthly soft support zone near 105.5 and the much stronger monthly support near 101 and change. Since we are looking at a USD/JPY chart that means there is an argument to be made for a strong upside resistance to a rising Yen and ergo most likely also for rising gold futures.
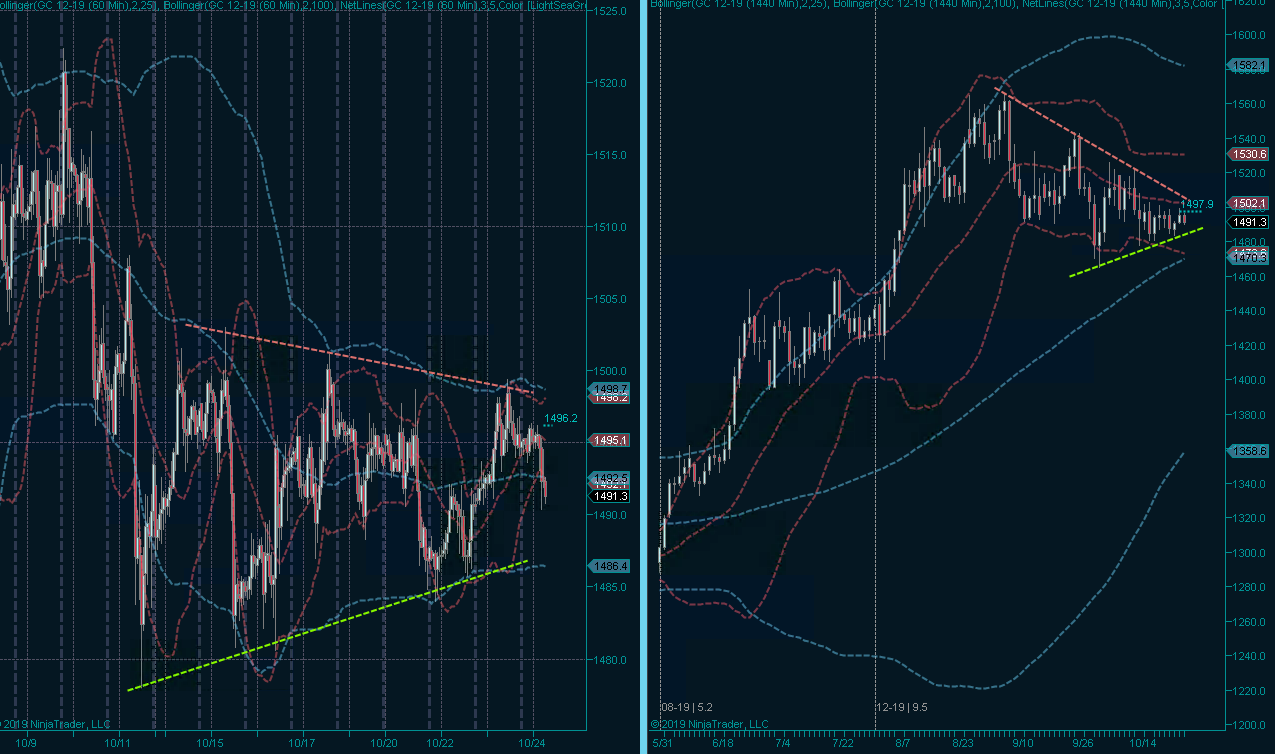
Speaking of which, now it’s finally time to look at some gold charts! On the short term end we are clearly seeing a sideways consolidation after a short squeeze that ended in late August. It’s been red candles ever since but gold seems to have found support after a brief stint near 1475.
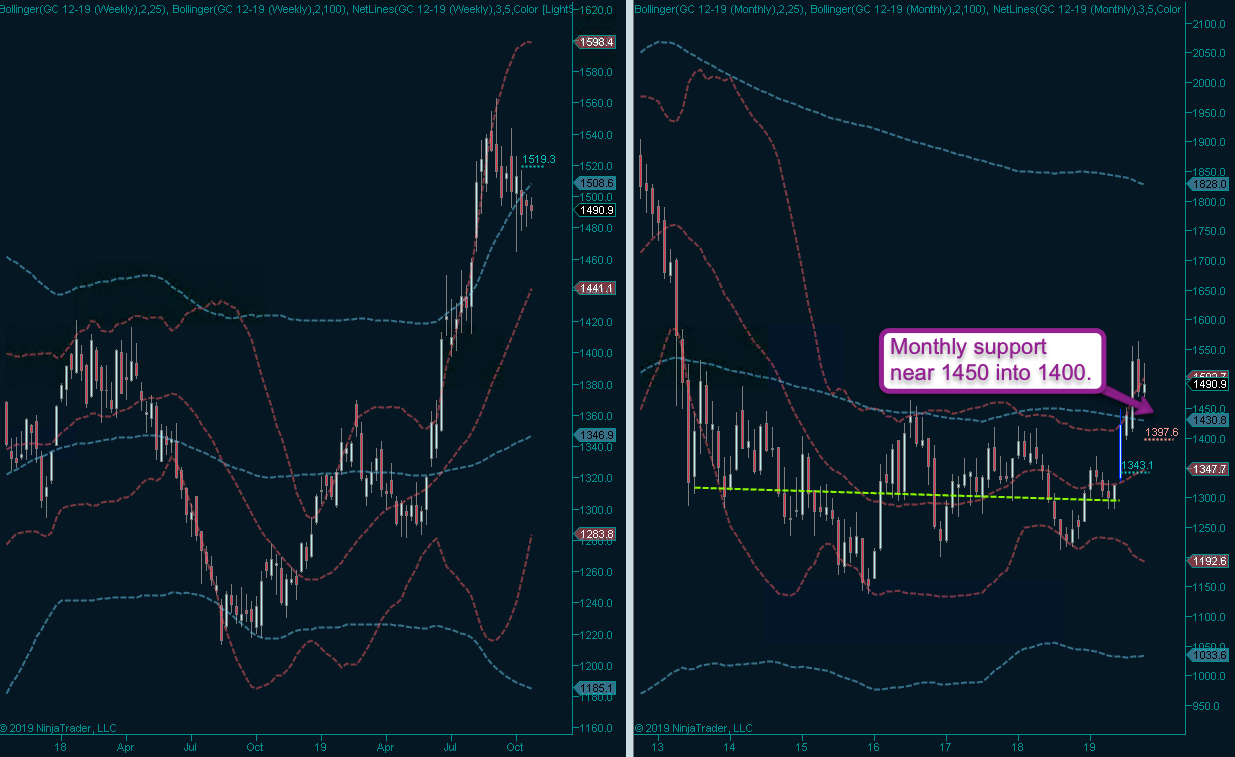
Now here is the one chart we’ve all been waiting for and probably the one that all the gold bugs are salivating over right now. I mean just look at this beauty – such a nice clean break out pattern, now followed by a retest of the ole’ 100-month SMA (which is still pushing sideways).
But to be honest it all looks way too easy to me. The Yen has not nearly fallen as much as gold has punched higher over the course of this year. And that’s fine of course – there is never a 1:1 correlation on the very long term.
However with the Fed back to its old POMO tricks you can color me a bit skeptical. I would very much like to buy a clean drop to GC 1485 (where the ST panel shows us a diagonal support line) and perhaps it would even be good for a short term punch higher.
Long term on the other hand I need a damn good reason to be long gold right now. I believe a much more profound shake out is necessary in order to chase off some of the weak hands. And by that I mean most likely a drop back toward the 1300 mark.
The alternative play would be to let the trend do the talking, which effectively puts us into a long position after a breach > GC 1550. I know – not very appetizing, but the odds would be much more in our favor.
Public Service Announcement
I won’t be posting tomorrow as I’ll be at the hospital for a battery of follow up tests. In case anyone cares: I am doing much better these days and have lowered my meds substantially over the course of the past two months.
During the worst of the worst about three months ago my doc had me on 9x5mg pills per day. I have gradually reduced that week after week and am now only taking one single pill. The blood panel of course will be the real judge, let’s hope it will also be the bearer of good news.


