


How The Best Laid Plans Fail
How The Best Laid Plans Fail
Yesterday’s session is a textbook example of how the best laid plans can fail. It’s also a welcome reminder as to why I don’t bother to count waves or rely on magic market cycle theories. If you skip back one post then you’ll see the binary setups I presented which, given the information at the time, seemed perfectly reasonable. Shortly after reality kicked in and swiftly tossed a crate of grenades into my nefarious scheme.
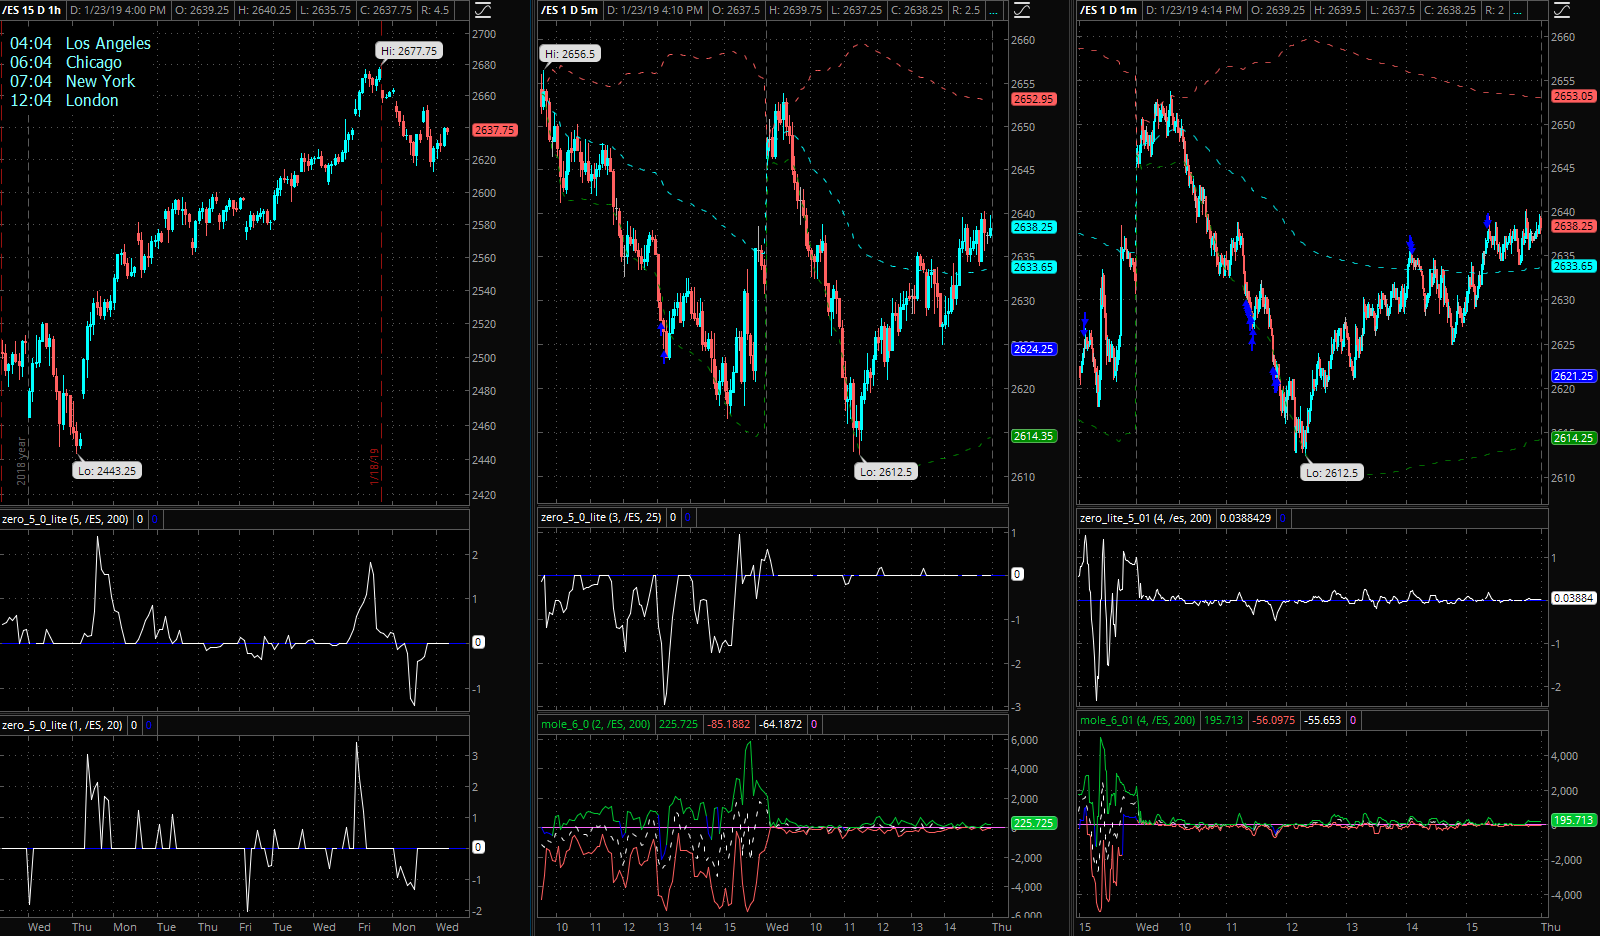
Our Zero indicator offers us some strong hints as to what was going on. Which is a complete lack of participation and clear signs that bot trading was dominating the tape. High participation markets don’t turn on a dime like that, and especially twice in the same session.
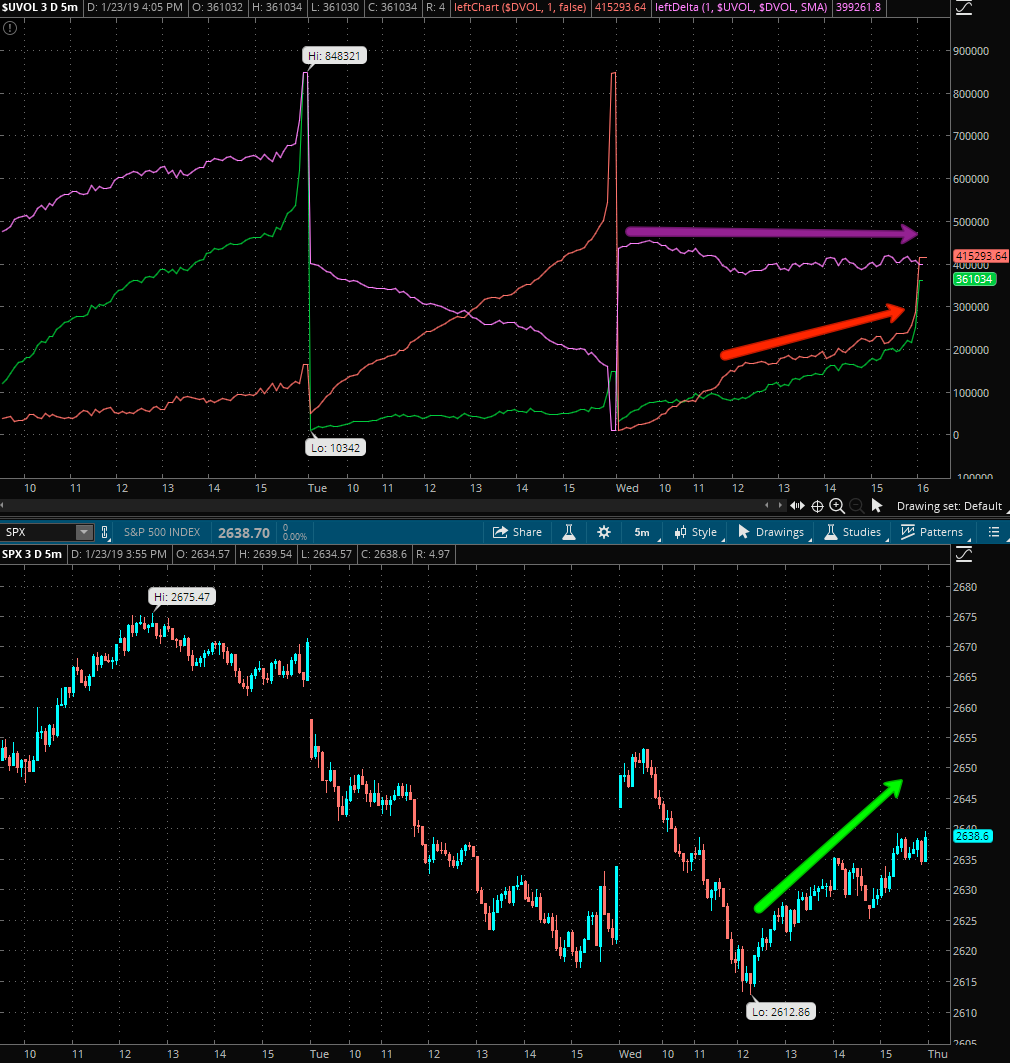
Here’s the UVOL:DVOL panel and I’ve pinned the SPX cash below it for some context. See how both turns merely make a dent in the respective signals as well as the ratio (in magenta)? What’s even strange is that the reversal was actually accompanied by a rise in DVOL which lasted all the way into the close. Possible sign of short accumulation?
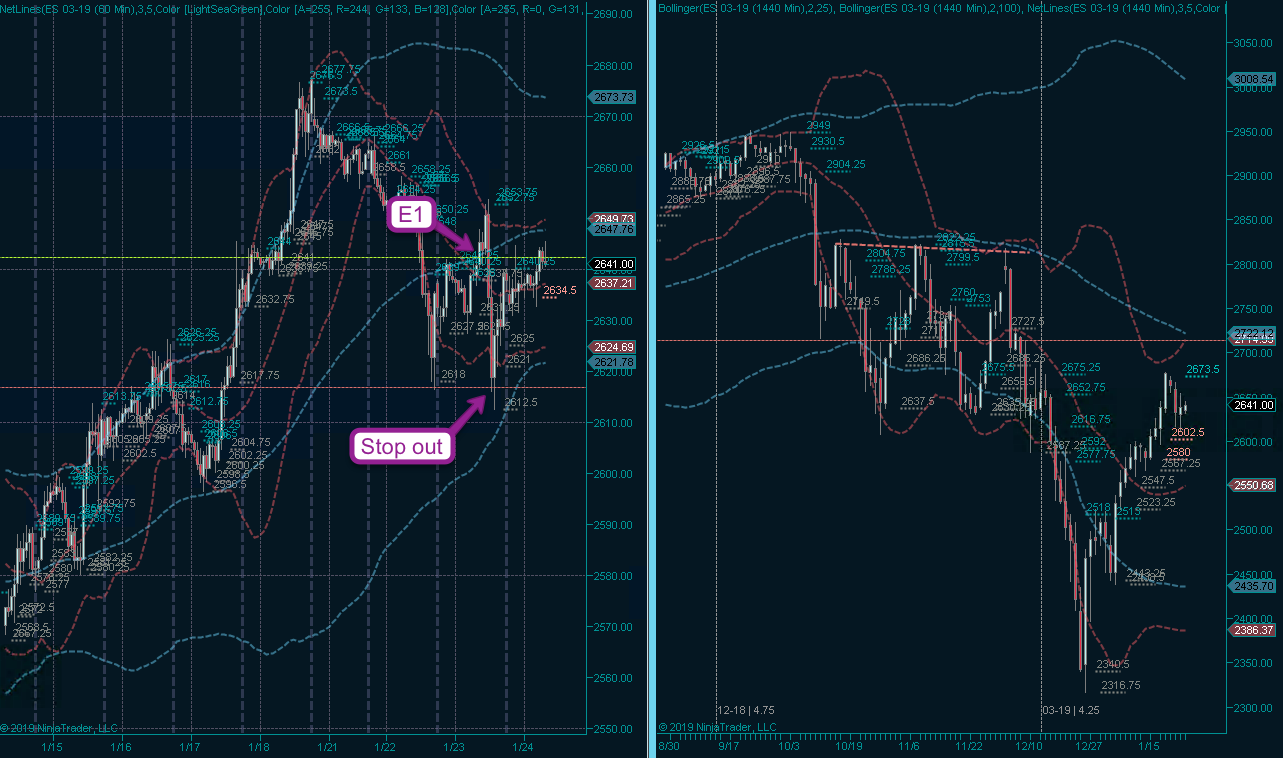
As you can see the open started to look extremely promising after which the floor suddenly gave out and eventually led to a stop out, once again almost exactly nailing my ISL. Seems like I’m just lucky this week…
My original plan had been to immediately go short but given what I was seeing in the market internals, and on the Zero in particular, I did not trust the sell off and decided to be conservative and wait for a retest. Which in the end saved my butt as the snap back was almost immediate.
HOWEVER that does not mean the bear is dead and that we’re going to necessarily see a massive rally after this double bottom fake out.
Let’s Talk Trend

As you may recall I’m I’m the process of recording a video series on system building and in that context had put together a few handy charts on market phases for a screen session.
The VolStat and StretchStat indicators above, both concepts I brazenly stole from Ken Long and implemented for NinjaTrader, may be useless when it coms to anticipating market phases. But they are excellent for showing us where we are right now.
And even Mr. Magoo would agree that we are knee deep in high volatility bearish tape right now. Which, as we’re increasingly finding out (and I had warned you about on numerous occasions) is a royal bitch to navigate.
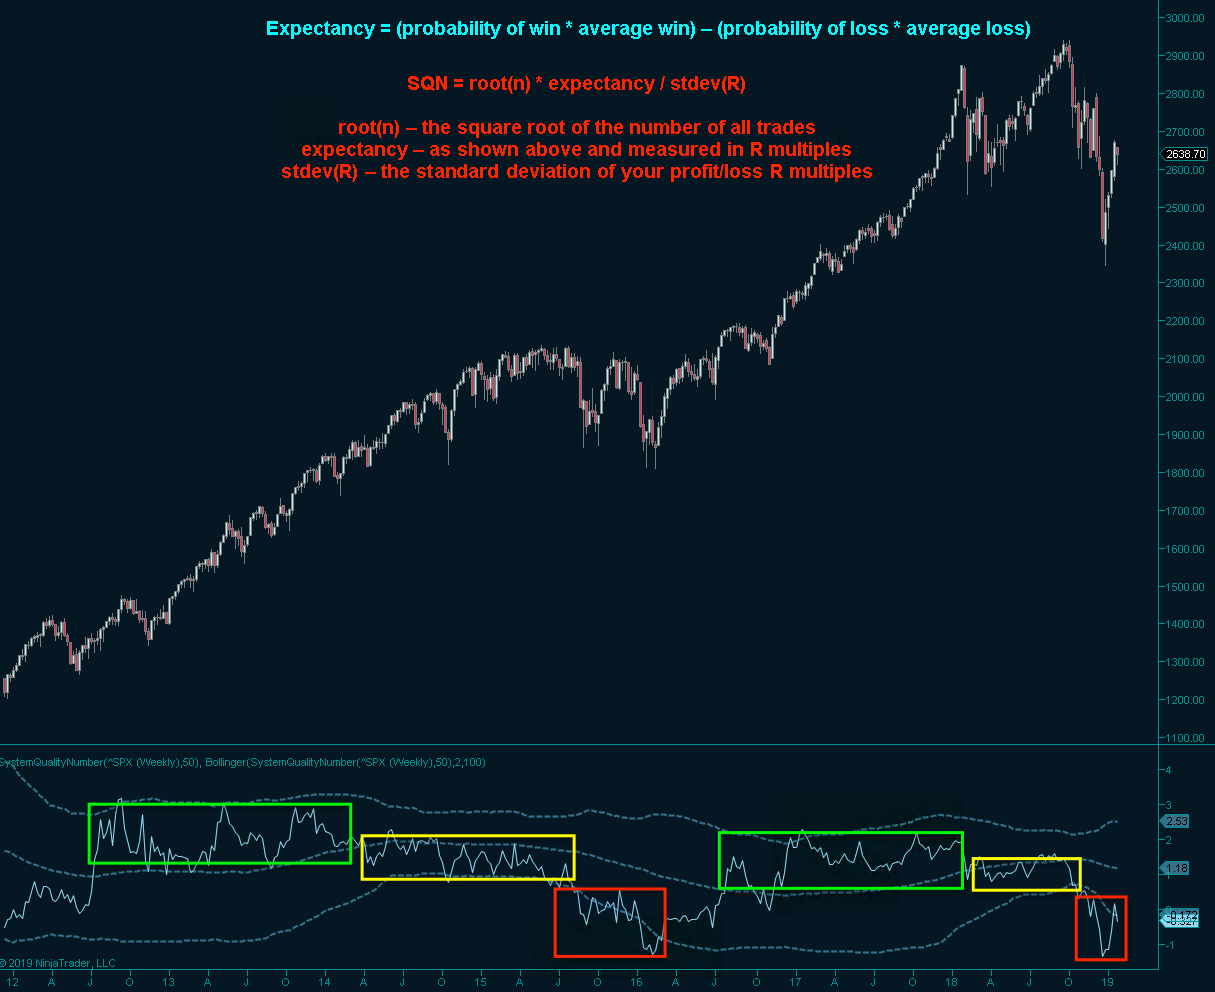
Here’s the SQN indicator I mentioned the other day but on a weekly chart. What blew my mind was how well it describes market activity in equities over the past seven years.
And then a second time when I realized that almost every single candle on this chart represents one whole week since I left the U.S. and moved to Spain in April of 2012. Insane…. where does time go?
Anyway, if we consider the ranges between the SMA and the upper/lower 2.0 Bollingers:
Framed in green are obviously times when the market is gaining on a net basis. BTFD on touches of that SMA in the center is pure manna from heaven. You GOT to love LV bull markets, so much fun.
Framed in yellow are the transition phases. Although price is still advancing its relative gain on a percentage basis has dropped and is unable to exceed the 100-week mean. Here both buying at the lower BB and selling at the SMA is working very well.
Framed in red are the sell off phases. Once the signal dips below the lower BB and remains there, unable to recover back above, a HV corrective phase is at hand. Theoretically attempts to recover are great opportunities to STFR but who is to say that you won’t be squeezed out this time around?
High Volatility Bear Markets Are Tough
And here’s how the cookie crumbles when it comes to trading HV bear markets or even when it comes to non-secular bearish market phases. A massive jump in RV (and IV) serves to make our respective lives hell, with yesterday’s session just being a modest example.
A week or two of it may be fun and exciting but a year plus of aberrant swings make us question ourselves and leads us to fill all that noise with our own opinions and various perspectives. It’s one thing to be right about the final direction, it’s quite another to actually trade it.
I Know What You’re Thinking
So I’m sure you’re now wondering if I’m going to use this jump higher for a discounted short entry or if I’m tempted to re-enter long.
My stop out yesterday wasn’t a big deal as I had employed small position sizing, which of course I had mentioned knowing the odds:
Nevertheless, given the general context of what I posted yesterday the long campaign has very low odds of succeeding but at the same time offers a low risk to benefit ratio. Or a high benefit to risk ratio if that makes more sense. Suffice to say that my position size is small here given the low chance of success.
We are basically back to where we were then and given the double bottom in place the odds for the bulls have slightly increased. But are they GREAT odds?
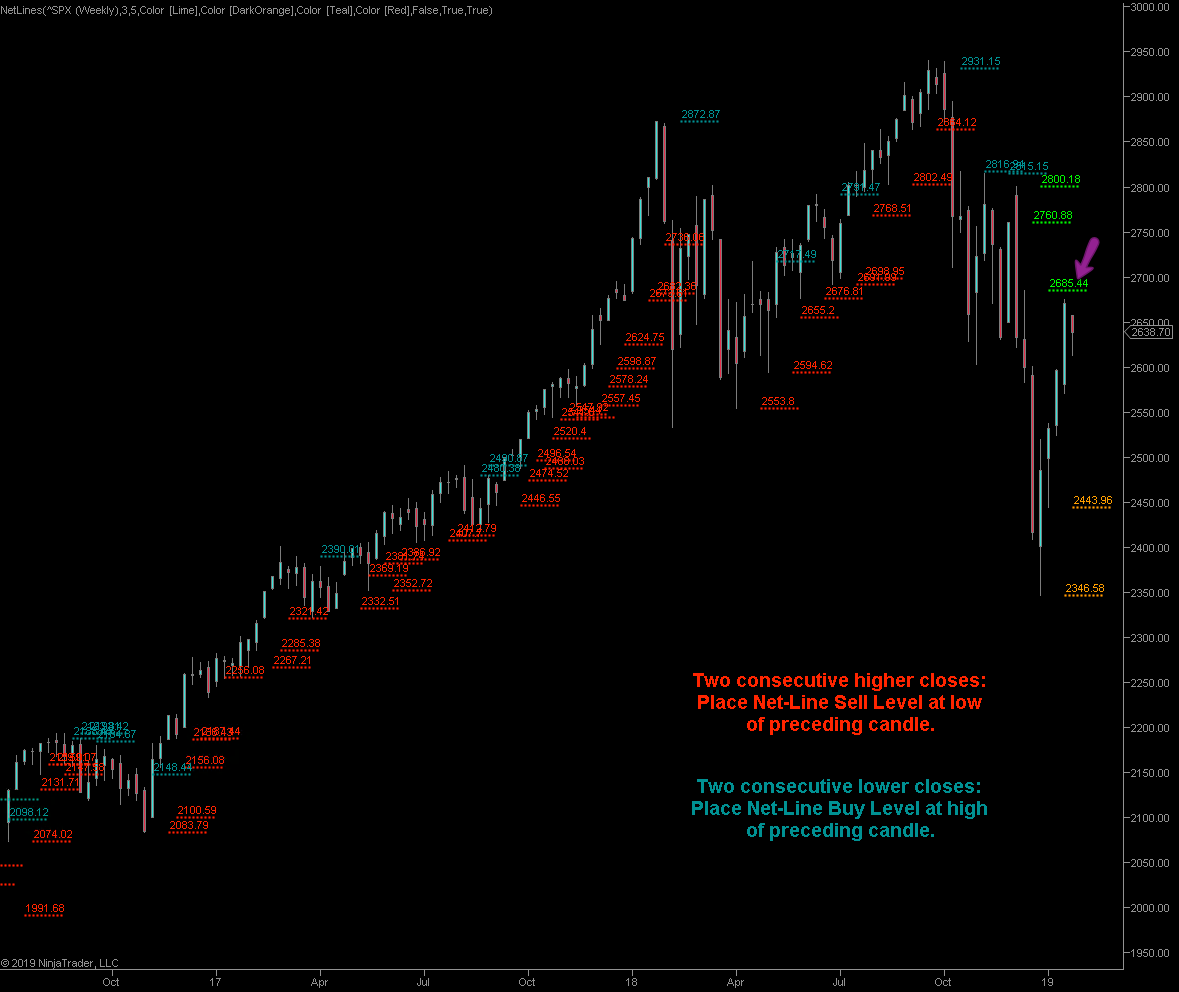
The LT trend charts above show us in a bearish market phase and it makes sense to not fight the overall trend until the NLBL at SPX 2685.5 remains in place. Yesterday’s entry was a low probability short term lottery long, but given what I’m seeing in terms of participation we can expect more monkey business and shake out attempts in the near future.
Bottom Line
So my assessment at this point in time is that short positions here are justified but need to be backed up by participation and market internals. That said, if you remember my big momo update then you know that the medium term internals do favor the bears again and given what I’ve seen I have a hard time imagining that the bulls are ready to turn the tide right here and right now.
I would love to see a nice divergent signal on the Zero indicator, more selling pressure, and at least a very convincing spike high in place before jumping into short contracts. As usual I prefer to work my way up from a short term entry which I can then transition into a medium term campaign.
On the long side it’s probably best to wait until the weekly NLBL at SPX 2685.5 has been overcome. At minimum a breach of ES 2673.5 needs to be on the table for me to re-consider a long position. And even then I need to see a convincing spike high in place and would be unwilling to employ a break out continuation strategy.
Why is that? Because had I employed one yesterday at the breach of the prior spike low then I would have gotten royally reamed overnight. And that campaign would have been following the ongoing trend, which is still officially down. After all the best strategy during HV tape is to buy and sell at potential price extremes.
Market Survival Rules
- Know what market phase you are in.
- Employ the proper trading strategy.
Makes sense. You don’t want to trend trade in a sideways market and you don’t want to trade mean reversions in a bull or bear market.
I know this sucks right now as it really puts us in a bind from a participation perspective. But it most definitely beats the alternative, which is getting caught up in the endless gyrations.
The bulls have enjoyed an easy ride higher from the lows. Now it’s time to demonstrate that they are willing to hold and extend re-gained territory when the going gets tough. Until that happens we are in a bearish market phase and should act accordingly.
A Final Thought
Reading all the above you may walk away with the impression that I feel very passionate about equities and that I’m determined to make a right call every step on the way. But frankly I don’t care this much as there so many other, much easier, markets to be active in.
But I know many of you do and as the humble host of this digital sanctum of reason and rationality I take my role very seriously. Plus it’s a great exercise in clearly expressing my own thinking process, which hopefully will be of value to you.
BobbyLow paid us a welcome visit yesterday, but it came with a stark warning in form of a sobering tale about one of his close friends, which I am taking the liberty to share below:
The market can be a cruel bitch and wipe us out in a heartbeat if we let it. I just had another good friend of mine get totally wiped out and after talking with him on the phone I can understand what he did even though he should never have done it. He was certain that this time was going to be different and that he would be able to recoup all his previous losses in one trade. He went in big on metal futures. The trade went against him and he received margin calls that he met and went in even deeper. Eventually he got totally wiped out and lost his entire life’s savings.
Scott used the term being carried out on a stretcher and my friend blowing up his account was just one more casualty of the trading wars. This one hit close to home because it happened to someone I knew. Having worked closely with Scott, I know he has gone down for the count a few times himself. I think Mole has had a few very close calls as well. Personally, I’ve gone down for the count so many times, I feel like “The Bayonne Bleeder” Chuck Wepner would have felt having gone up against Muhammad Ali over and over again.
It took me many years to get it through my thick scull that when in the midst of battle, a seasoned vet like Mole or Scott says duck that I better hit the ground. Another thing that took me many years to realize is that I must have a system that fits my personality and risk tolerance.
If you think you are immune to this then think again. A good friend of mine, who happens to be a professional quant trader at a Chicago firm, made one emotional decision last March which basically ended up robbing him of an entire year’s worth of trading profits.
He didn’t blow up and he’s back in the game now. But the lesson learned is that this is all it takes, guys. And if it can happen to a professional quant trader with an IQ well over 140 and over a decade of hands on experience then what do you think are the odds it can happen to you?
“There are old traders and there are bold traders, but there are very few old, bold traders.”
— Ed Seykota
Wise and humbling words to live by.


