


How To Roll With Price At Inflection Points
How To Roll With Price At Inflection Points
Earlier this week we covered how to recognize trend reversals with nothing but plain old vanilla price charts. In essence this involves establishing a sequence of higher highs and higher lows (or lower highs and lower lows during a sell off) which should remain unchallenged during the meaty part of a trend.
It is also important to keep an eye on realized volatility, especially during transitory periods preceding a threshold breach. An increase in volatility does usually suggest a weakening of the trend.
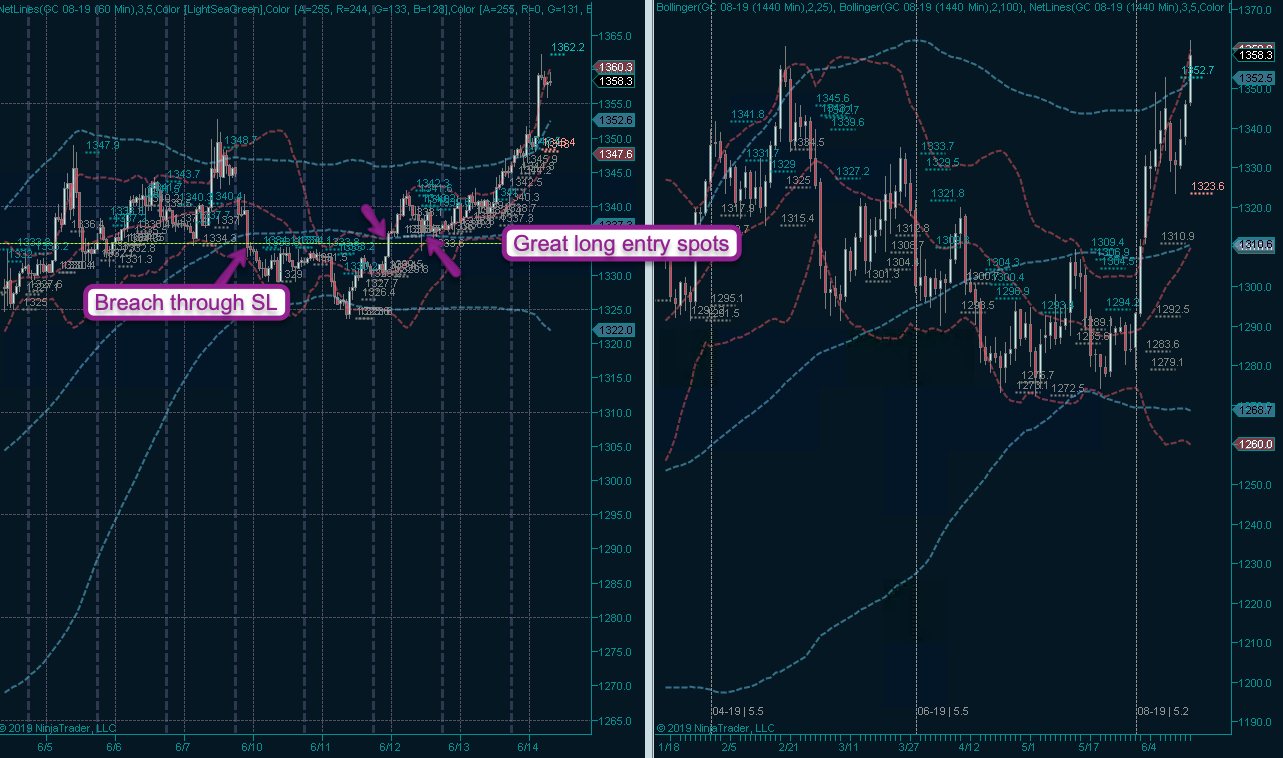
I wanted to return to the gold futures example I used in my previous post. As you may recall I pointed at the spike low breach and failure to recovery that threshold as possible evidence of a breach in the trend. Admittedly it was early in the process but at the time of observation the gold bugs looked like they were in trouble.
Of course just a day later that same threshold was re-conquered, which is why I wanted to revisit this chart and share my thoughts. First up of course no tape reading rule is chiseled in stone and if price happens to re-conquer a previously failed threshold then one is well advised to pay attention.
As a matter of fact, some of the juiciest entry opportunities occur when one thing is ‘supposed to happen’ but then for some reason doesn’t. So as soon as the 1335 treshold was breached the short scenario was losing some of its luster. Where it started to get in trouble however was the retest (second arrow) which IMO represented an excellent long opportunity in anticipation of trend continuation.

Given the gold example let’s direct our attention now to the hourly E-Mini chart as of this morning. BTW we just rolled into the September contract, so the summer doldrums are officially on the roster!
If you recall my observations regarding the weakening of a trend: In the center of the chart we have a first spike high breach on 6/4 followed by a second one later in the very same session. Not surprisingly what ensued was a massive short squeeze that advanced the S&P by nearly 150 handles.
The rally has clearly weakened over the past few sessions, beginning with the first spike low breach on 6/11, followed by two more on 6/12, probably due to the possibility of a military conflict involving Iran. At this point the general expectation was that we were looking at a more pronounced correction.
Unfortunately the contract rollover is throwing a bit of a monkey wrench into my analysis right now as I cannot be sure that the current spike higher actually has legs. Also there is the looming Fed meeting next Wednesday which involves an interest rate decision.
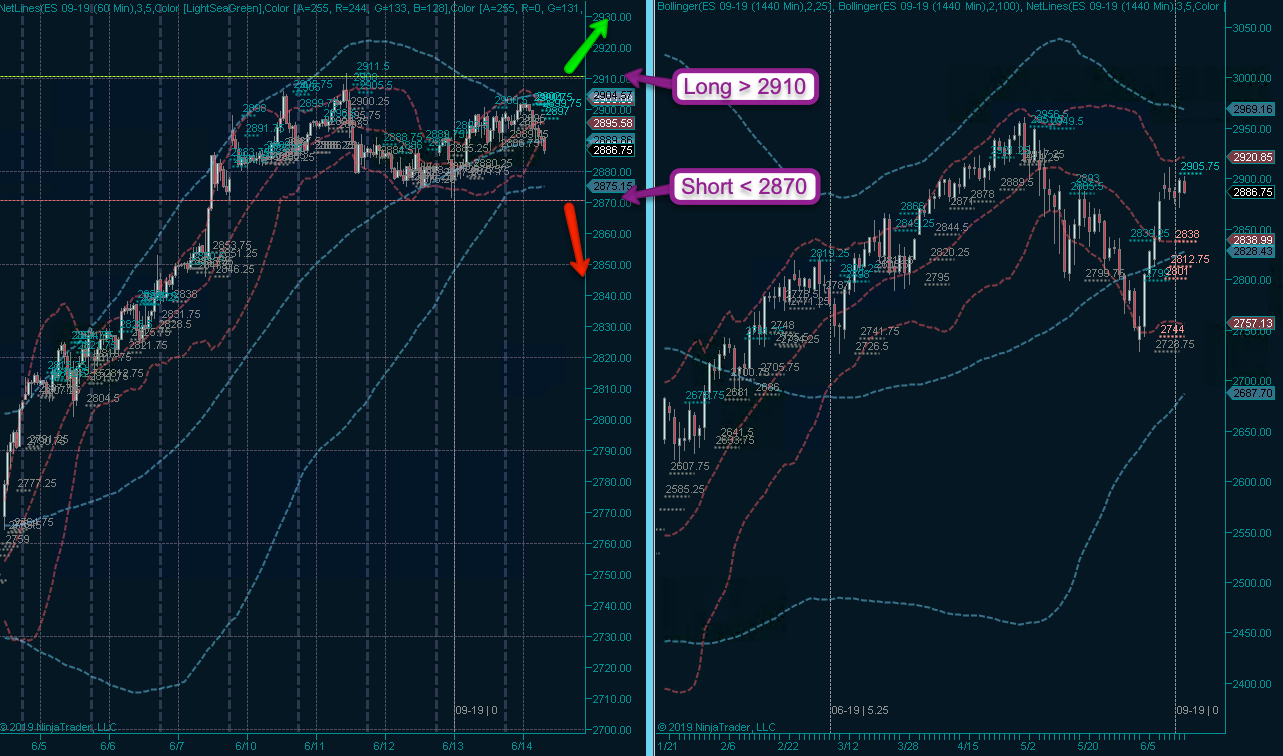
In situations like these I prefer to let price do the talking by establishing two thresholds, according to the motto that it’s better to be late to the party as opposed to not going and missing out on a hot morally ambivalent debutante eager to make your acquaintance.
So what I want to see here is either a breach of ES 2910 or a drop through 2870. On the short side I would probably prefer a retest after a drop below. Also I would not want to take either entry later than Monday morning and would close it down before the Fed meeting unless a respectable distance from the entry threshold has been established.

NYSE UVOL has been playing ping pong over the past few sessions and the smoothness of the signal suggests that the bots are in firm control of the direction.
However there is one chart that should give us cause for concern. Please meet me in the lair:

It's not too late - learn how to consistently trade without worrying about the news, the clickbait, the daily drama and misinformation. If you are interested in becoming a subscriber then don't waste time and sign up here. The Zero indicator service also offers access to all Gold posts, so you actually get double the bang for your buck.
Please login or subscribe here to see the remainder of this post.

I told my subs to keep an eye on soybeans the other day, and in particular I suggested to look out for a convincing looking floor pattern, which was delivered a day later. Which we received two days later – once again a double spike low breach sealed the deal on an advance higher.
I think this is another great example of how to establish entry binary entry thresholds at inflection points. And I like this example in particular due to the velocity of the price action – i.e. one is barely able to see any candle wicks while price was bouncing up and down.
Also note how quickly price rose and how long it take to descend back lower. The final give-away was the gap before the threshold breach, which again put the bears on notice. As you can see by simple interpretation of the price action we are able to collect many key observations that help us in our discretionary trading.
Once again, this is a topic I have spent considerable time covering in my Price Action Master Class I’m about to release by early summer. Definitely a series to look forward to if you are a discretionary or systemic trader.


