


Markets And Volatility
Markets And Volatility
By all definitions the past two years have been pretty challenging to many retail traders and not surprisingly the exhaustion I sense in the comment section is palpable. A lot of what has transpired can be attributed to a marked increase in realized volatility which over time has contributed to a now permanently elevated baseline in implied volatility.
I’ve covered that phenomenon in my various long term market updates but today I would like to take a step back and hopefully squash a number of misconceptions about market volatility and also address how it may affect your trading reality.
However, people talk about ‘volatility’ all the time and often mean completely different things. So before we move any further we need to establish a clear definition of what volatility is and how we can measure it. To that end let me to walk you through the basics.
Realized Volatility
First of all we need to differentiate between realized volatility (or often referred to as historical volatility) and implied volatility.
Realized volatility is easier to understand. It represents to the magnitude of the actual price movement in a particular financial instrument over a defined period. So what RV expresses is the range of the price swings in that period.
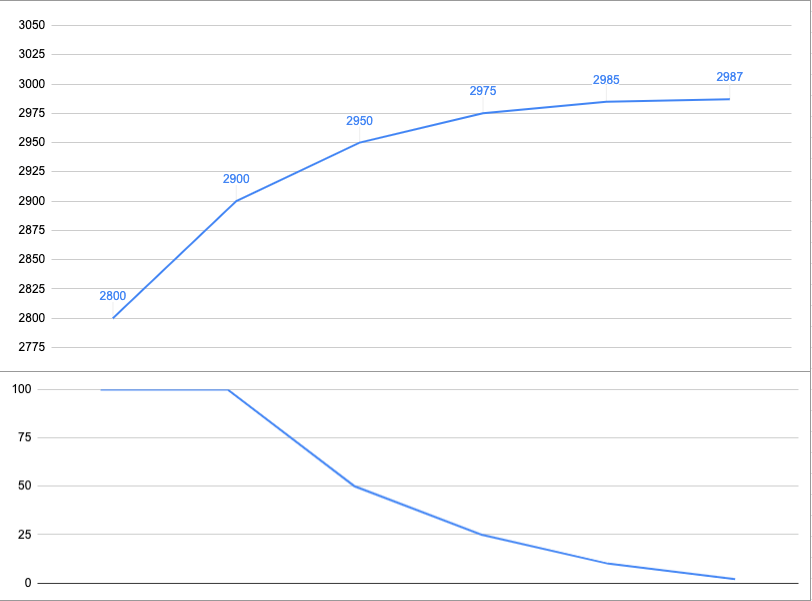
Let me give you an example. If the S&P goes from 2,800 to 2,900 in a week then that represents an advance of 100 handles or 3.6%. And if it then goes from 2900 to 2950 the week after, then that represents an advance of 50 handles or a 1.7%.
Okay, so far so good. Now if the S&P goes from 2950 to 2975 the following week then that’s another advance of 25 handles or 0.8%. Finally the week after we have yet another advance of 5 handles from 2975 to 2985 or 0.3%.
By the way, mathematicians, financial analysts, or quant traders don’t ever talk about drops or advances, they simply refer to them as signed returns. And signed of course means that the number can be either positive or negative. Keep that in mind for later.
By calculating the percentages we basically create what is called ‘normalized returns’ or ‘percent returns’. That allows us to measure all variables in a comparable metric.
Alright, now let’s look at the series of percent returns: we have 3.6, 1.7, 0.8, and 0.3.
You may have noticed that the returns are getting smaller, and although the S&P has gone from 2800 to 2975 in four weeks, it’s doing it in ever-smaller intervals. If we calculate the difference between each consecutive return (the percentages) then we get to -1.9, -0.9, and -0.5.
This is only one among many ways of measuring realized volatility, but in any case it clearly is dropping. So this exercise may give you an idea why we bother to look at realized volatility in the first place.
If we plot this series as a graph, as shown above, then we quickly grasp that the vehemence of the rally is diminishing and that perhaps a correction lies ahead.
Implied Volatility
In contrast to historical volatility, implied volatility aims to look ahead. It is often interpreted as the market’s expectation for future volatility of a stock and is implied by the price of that stock’s options.
Here “implied volatility” means it is not observable in the market but can be derived from the price of an option. In simple terms, implied volatility or IV is determined by the current price of option contracts on a particular stock or future.
It is represented as a percentage that indicates the expected one standard deviation range for the stock based on the option prices. And for that reason that number is unsigned, meaning it’s always a positive number.
For example, an IV of 25% on a $200 stock would represent a one standard deviation range of $50 over the next year.
Okay, so what does ‘standard deviation’ mean?
In statistics, one standard deviation is a measurement that encompasses approximately 68.2% of outcomes. When it comes to IV, one standard deviation means that there is approximately a 68% probability of a stock settling within the expected range as determined by that stock’s option prices.
In the example of a $200 stock with an IV of 25%, it would mean that there is an implied 68% probability that the stock is between $150 and $250 over the coming year.
And why does any of that matter?
Because options essentially came into existence as insurance contracts, and when the future of an asset becomes more uncertain, there is more demand for insurance on that asset.
When applied to stocks, this means that a stock’s options will become more expensive as market participants become more uncertain about that stock’s performance in the future.
When the uncertainty related to a stock increases and the option prices are getting more expensive, IV will increase. This is sometimes referred to as an “IV expansion.”
On the opposite side of IV expansion is “IV contraction.” This occurs when the fear and uncertainty related to a stock diminishes. As this happens, the stock’s options decrease in price, which results in a decrease in IV.
In summary, IV is a standardized way to measure the risk premium (vega) charged on the options of a stock.
In part 2 of this series we are going to delve into the inner workings of the VIX index, its history and how it came into existence, and most importantly what exactly it attempts to track.


