


Realized Volatility Release
Realized Volatility Release
The eternal ebb and flow of realized volatility (RV) is a key concept in order to understand what has been happening in equities over the past week or so. For over six months now we’ve seen a marked increase in RV which in the process it has claimed numerous victims in both the bullish and bearish camps.
A rise in volatility is traditionally attributed to downside corrections, but we are talking about realized – not implied – volatility here. The former is comes as as signed value and the latter as an unsigned value. The indicators I use on the other hand normalize the signed value as I’m mostly interested in the magnitude of the swings. Clear so far?
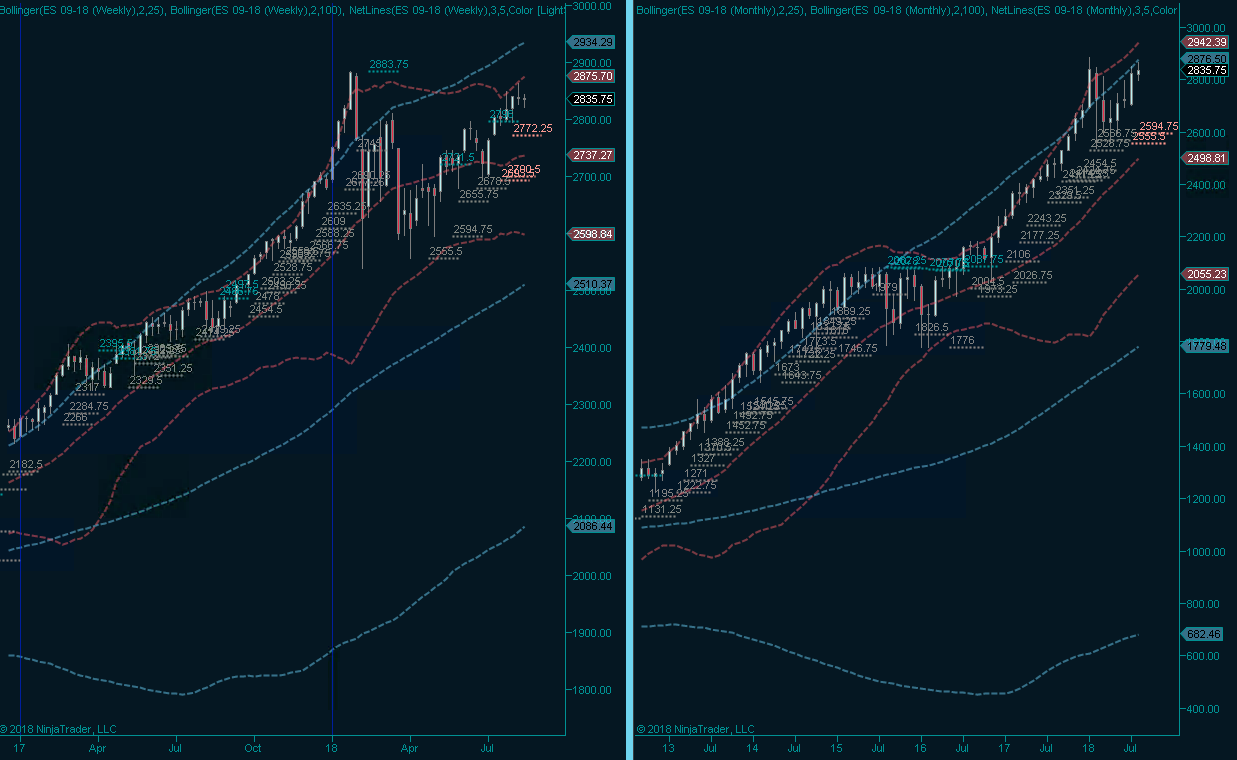
From a pure price perspective all one needs is a cursory glance at the weekly E-Mini panel to realize that we are in a completely different market phase than that of early 2016 into late 2017. Even the bullish reversal from the lows near ES 2560 has been spasmodic and chock-full of traps and tribulations. So simply from an RV perspective this is not the same smooth ride in the sun we enjoyed until late last year.
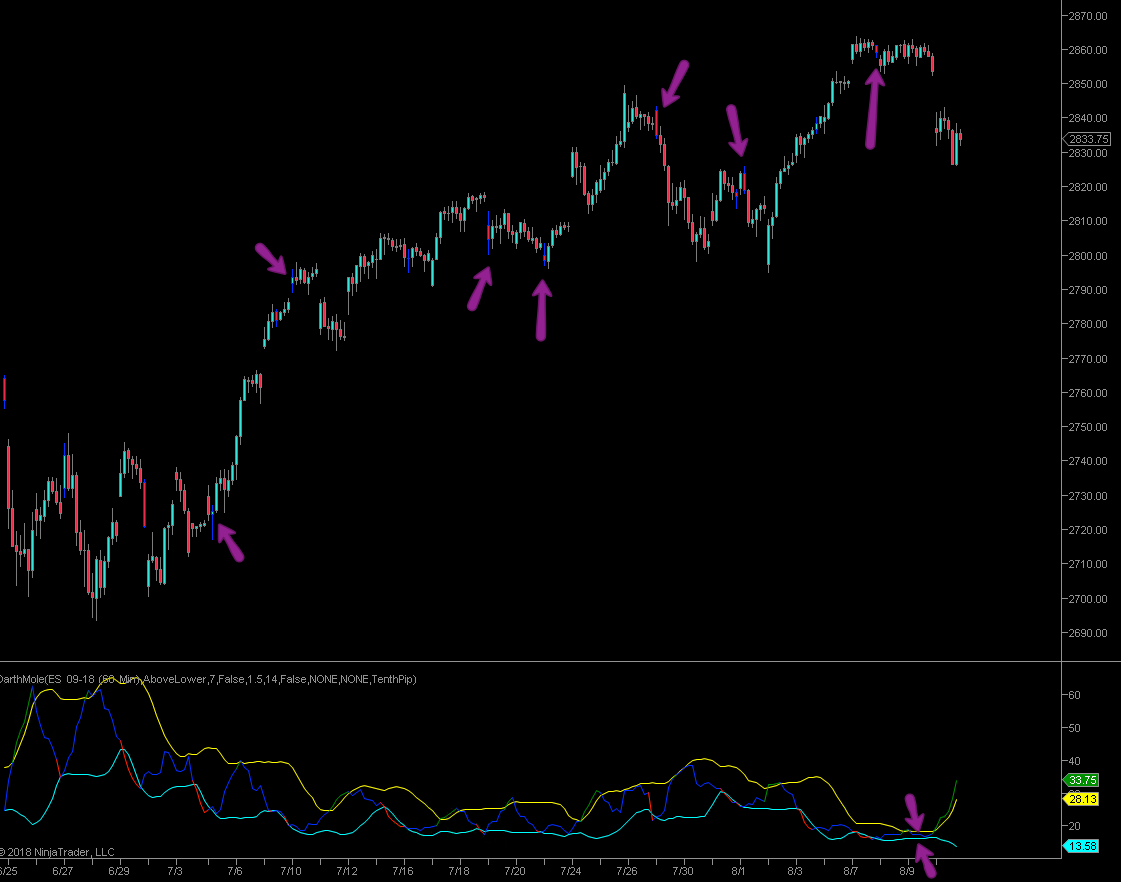
Here’s a 60-min chart of the recent price action via my preferred RV indicator. If you want to recreate it you can use an ATR(14) and then wrap your favorite BB around it, which should make it look similar (but not a cool – haha). What I’m highlighting on this hourly chart via blue candles are the swings from below the BB back into it, which is usually followed by an increase in RV.
Now again, we never know whether it’s going to be a swing to the downside or run toward the upside, although RV itself is directional the way we express it here is not. All we do know is that odds support an RV increase, especially if the BB has been reduced to what I sometimes call the ‘head of the anaconda’ as we saw just last week.
In other words, the tape had been slowing down to a sideways crawl and that is not usually a situation that prevails for a long time. What we got of course is a quick wipeout downwards instead of what many had expected: a breach of the coveted 2900 mark, and in the process of course the recapture of the early 2018 all time highs.
If you look at the chart above then you see that the signal has gone straight up and will at some point re-enter earth’s atmosphere and then drop below the BB signaling a gradual reduction in RV. When I set out to my research in realized volatility cycles (RV cycles) a few years ago my hope was that I would find patterns that would show me directional bias when it came to various RV cycles.
Unfortunately the answer is not as clear cut as one would like, in that it is strongly market phase dependent. In trending markets a decrease in volatility usually favors the underlying trend. Wave wankers would say that RV decrease happen during the 4th and 5th leg of a wave formation. For the rest of us those are the late phases of a trend.
If the trend is weakened or if we’re in a small sideways range then reduction in RV means just ever smaller swings all over the place. Which in turn will at best help you when setting your stops as a swing trader or scalper.
In larger high volatility sideways ranges RV rolling < the upper BB is often accompanied by a reversal, so in that context it’s a good way of planning your entries and exits. And in a way that makes sense as RV expresses the velocity, the vehemence, of the price action in a particular time period. As a side note it seems to me that the high velocity side is usually the one winning out in the end, as for example shown in the swings in late June (left of the RV chart above).
So where does this leave us today? Well, we are most definitely not in a sideways range – at least not yet. RV was minuscule and now increasing sharply – we are not even seeing signs of a reduction, thus pushing the signal back < the upper BB on my chart above.
I think that this week marks an inflection point as a lot of market participants were mentally primed for the potential of new all time highs. Serving them the oppose this week was that big monkey wrench many were not prepared for. I pose that RV will remain elevated for quite a while, at least going into mid next week.
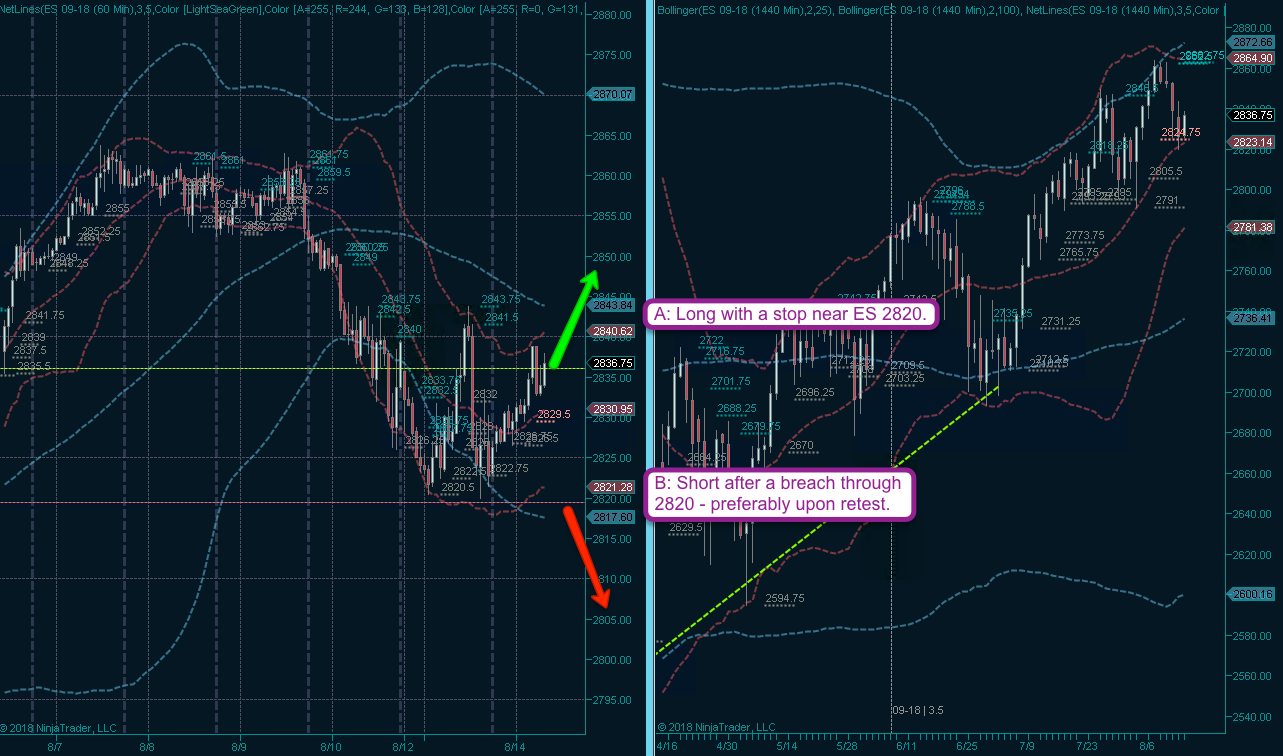
So looking at the double bottom I can’t help but consider two scenarios: This is either a massive bear trap or we drop much much harder than anyone currently anticipates. Either way I want in. So I’m long right now with a stop near 2820. If that gets taken to the woodshed then I would want to be short, preferably after a LKGB retest on the short term panel.
I hope this helps, if not just ask away in the comment section.


