


The Art Of Swinging For The Fences
The Art Of Swinging For The Fences
A subscriber who bought my Options 201 course wrote me today asking for some clarification on how to best stack your weekly butterflies. There were four aspects to his inquiry, namely: 1) which expiration to choose on which days of the week 2) how to distribute your exposure 3) deciding directional bias and 4) structuring ones trade based on the current IV environment. Let’s tackle these questions one by one:
First up let’s set the stage by pointing out that no option related trading system should be followed in a purely robotic fashion, unless of course it’s a black box trading system but that’s a post for another day. Before placing a single trade you must ask yourself a number of questions:
- Why am I doing this / what is my edge?
- What is the expected outcome?
- What is the risk to reward ratio?
- How much capital should I attribute to this trade?
This post will focus primarily on the first two aspects of this checklist as the other two have been addressed here on multiple occasions.
Which Expiration To Choose On Which Days Of The Week
The answer to question #1 can be answered as follows:
Statistics show that the SPY and the SPX have a strong tendency to close the week near their respective expected move (EM) thresholds, which we refer to as expected price thresholds (EPTs). This phenomenon has been amplified by the widespread introduction and proliferation of weekly options in early 2016 and continues to date. The cost basis of options with strikes near these EPTs appear to be improperly handicapped, in that the probability of touching greatly exceeds the probability of expiration near those strikes. Extrinsic value in option premiums is largely derived from the probability of expiration, thus this discrepancy offers us a strong and consistent edge we seek to exploit to our benefit.
Now given the above we can derive a few important take aways. If option premiums are a tied to implied volatility and we seek an edge in trading weekly options then we are primarily interested in its implied volatility and by extension the price range shown in the expiration we plan on trading. Recall our little checklist from above – we never do things in a robotic or mindless fashion.
Also remind yourself that price and volatility are intrinsically linked when it comes to trading options. There is no difference whatsoever, at least when it comes to an option’s extrinsic value. The higher the IV for a particular strike the higher its premium and vice versa.
An important dimension of volatility of course is time. If the same stock has an 80% chance of climbing 100 handles in one day then that’s very different from an 80% chance of climbing 100 handles in 1 year. The former expectation will produce a much larger implied volatility ranking than the latter.
All this taken together immediately answers question #1 – which expiration to choose on which day of the week. If I trade a Friday expiration on a Monday (or Friday evening) then I am squarely focused on the implied volatility of that one contract only (and by extension its expected move). I am not interested in the underlying stock’s annualized IV or that of any other contract. Because I’m not trading those – I’m trading the Friday contract.
On the other hand if I decide to take out a trade involving a Friday contract a Wednesday before its expiration then I will still have to use that contract’s IV in order to assess its anticipated expected move. It will have changed of course in the interim since much time has passed. Implied volatility may be similar but its expected move range will be smaller as there are fewer days left for things to move around.
How To Distribute Your Exposure
The answer to #2 depends on your trading style and how much of your assets you want to allocate to this strategy. It’s perfectly passable to simply take out one single butterfly each week on a Monday and close it out on Friday. Of course in that case you are making more of a directional bet as you have to pick between the lower and upper EPT when placing your butterfly.
I personally prefer stacking which means that I take out a new trade on Monday and then another Wednesday. Sometimes I add one more on a Friday which I close out on the following Wednesday. This allows me to spread out my exposure a little more and also lets me respond to various swings in the market. Obviously I won’t take out a second bearish butterfly if I already placed one on Monday and the market already moved in my favor.
Deciding Directional Bias
I sort of already answered that in the previous paragraph but in general the idea of this strategy is to trade directionally agnostic, meaning I am only partially concerned with direction. Let me qualify this statement by assuring you that direction is absolutely a factor. But as many of us may have learned the hard way: it’s almost impossible to predict direction, even on a short term basis.
There’s actually statistical analysis out there by various quant firms which confirms this, and for that reason attempting to pick between one of the two EPTs each week is tantamount to a coin toss. But we can increase our chances by spreading out our exposure, which is the equivalent of throwing several darts as opposed to only one. Yes, this will increase our cost basis but there is a sweet spot in the middle in which we still pay less than we gain over the long term.
The approach that I usually take is to look at my statistics tool for the SPX and pin the tail on the donkey based on the historical bias of that particular week. Once again I’m not robotic about this of course and if the market has already moved significantly then I may decide to go the other way. What I’m pretty religious about however is alternating between bullish and bearish butterflies. There are always exceptions of course but as a rule a bullish placement is usually followed by a bearish one, especially if the market has moved in my favor. I may skip a campaign if the market has made a strong move against me and price is already in earshot of the opposing EPT.
Structuring Ones Trade Based On The Current IV Environment
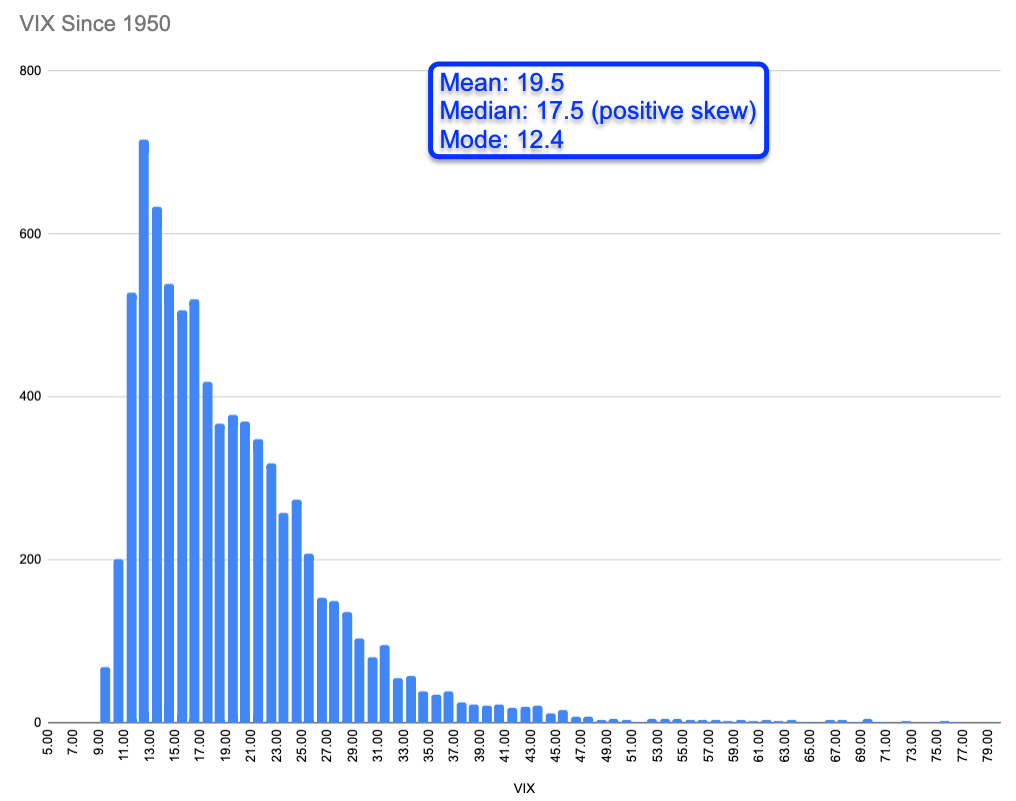
It’s clear that implied volatility, albeit being stationary (i.e. non-directional – no random walk) is not normally distributed. I had guessed the median pretty well but it’s actually 19.5 – so let’s call that medium IV. We have positive SKEW here in terms of distribution plus we have a very long tail that extends all the way into 75.
So what’s ‘low’ IV? I would pick the mode which stands around 12.5 and of course there’s a range around it. I have never seen a VIX below 9, so the low IV range is somewhere between 9 and 15. Everything above until about 25 should be considered medium IV and I know that as a fact as automated systems start to behave very differently once the VIX pushes above the 25 mark.
Meaning hard stops cease to function completely and in fact will utterly decimate your edge. Directional trading becomes increasingly difficult with every additional VIX handle higher until trading it turns into a losing proposition. On the options side selling premium above the 20 mark is not for the faint of heart and should be avoided at all cost.
From a trading perspective this means that throughout history the VIX has been thought of being ‘normal’ between 10 and about 20 – beyond that we start pushing into crazy time. One aspect the histogram does not show is that high IV usually begets even higher IV – it’s a bit like a reverberation effect, which is the phenomenon when a sound or signal is reflected causing numerous reflections to build up and add to the exiting signal.
In any case, the pricing of options is directly linked to this very histogram but in an inverse exponential fashion. Meaning that the further out you go the larger the premiums and it’s not a linear scale but an exponential one. This is the very reason why selling OTM premiums is often called ‘picking up pennies in front of a steam roller’ – it works gangbusters for long periods of time but when it goes against you it can take out your entire account in a single session.
This is the reason why gauging the current IV environment and projecting forward based on e.g. the VX futures, option pricing, SKEW across the option chain, and other tell tale signs is so crucial. Make no mistake, it’s the option market that is driving equities these days, not the other way around. And expected move is an integral aspect of trading options, one that should be a key tool in your trading arsenal.
Shameless Plug
It’s not too late – learn how to consistently bank coin without news, drama, and all the misinformation. If you are interested in becoming a subscriber then don’t waste time and sign up here. The Zero indicator service also offers access to all Gold posts, so you actually get double the bang for your buck.


