


The October Roller Coaster
The October Roller Coaster
It’s the first Monday in October and that means it’s time to talk monthly statistics. Which are actually super interesting if you’re a stats nerd like me. But even if you’re not you should take heed as there are many misconceptions about this months floating around out there. So let me try to set the record straight, and I’ve brought plenty of exhibits to back up my bold claims.
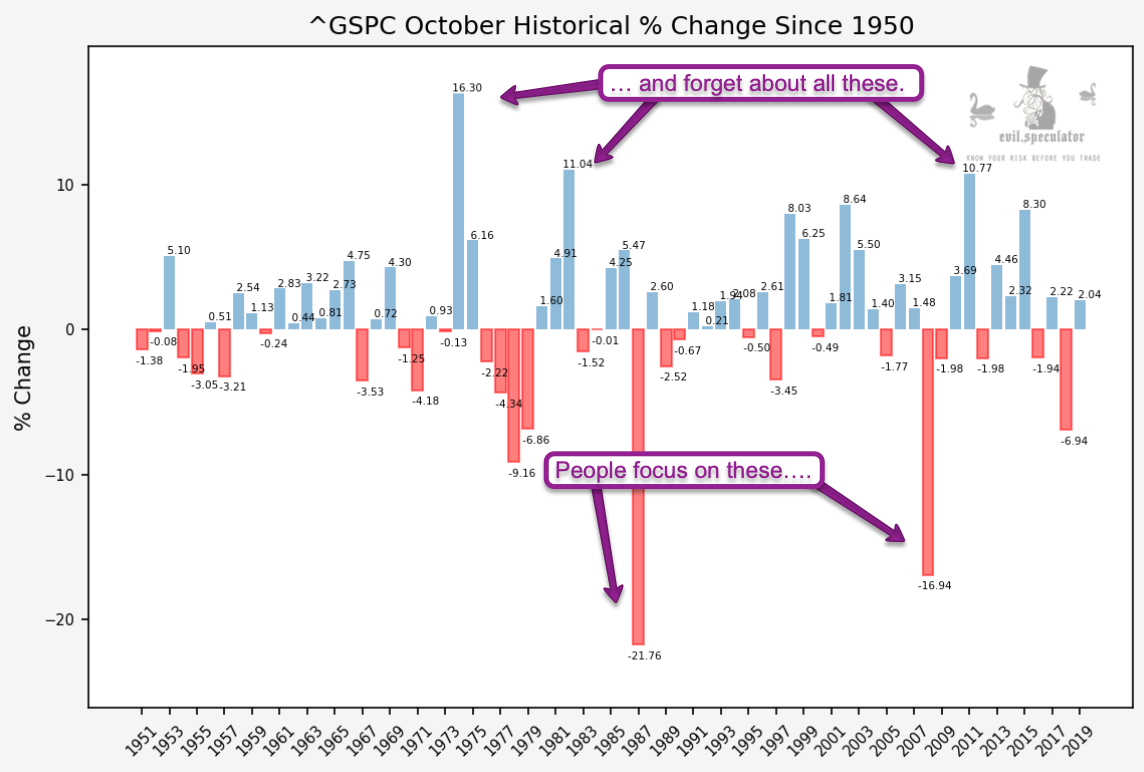
I think this historical change % chart paints the picture pretty nicely and should prime you for what’s to come below on a purely visual basis. Some people prefer cold hard numbers but as most of you I am actually not a math genius and prefer to look at things visually.
What stands out are two things: Standard deviation – which we’ll address in a minute – and its impact on human perception. Per the latter point I don’t know many traders worth their salt who haven’t at least read about the market crashes in 1987 and 2007.
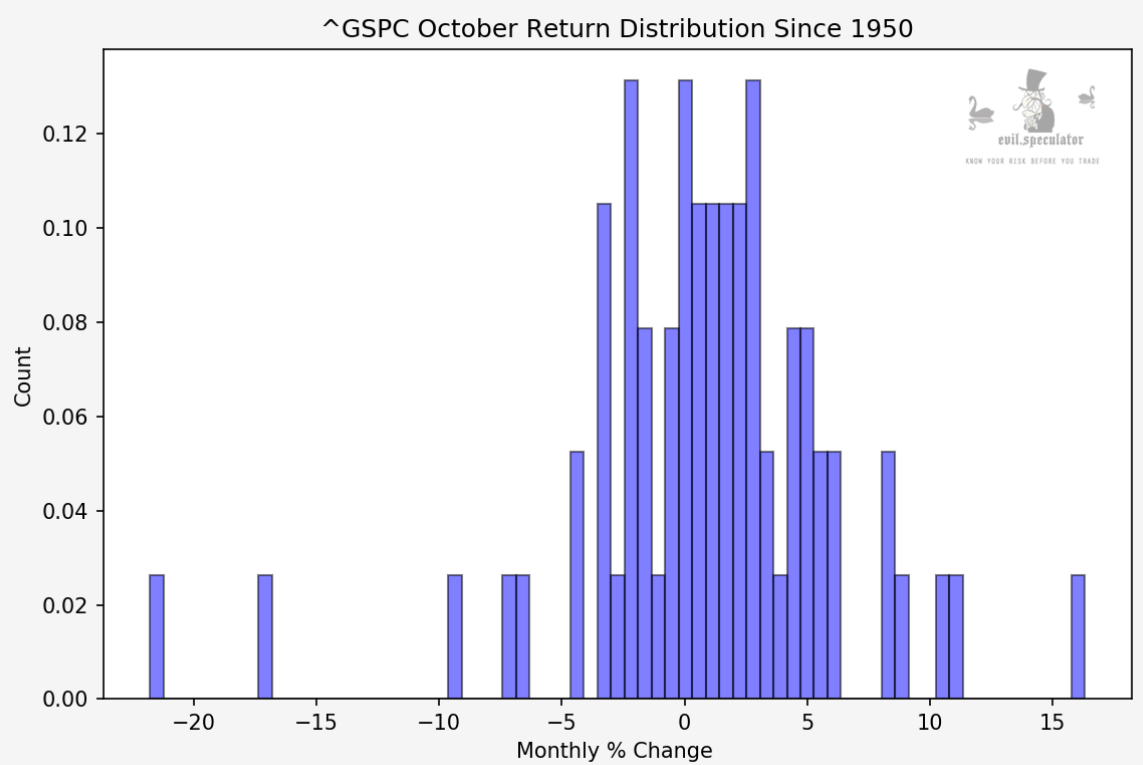
And that’s why October is generally viewed as a bearish month with crash potential. Now I’m not going to tell you that it’s great month for buy & hold investors but if you cut out these two incidences then consider what remains, which is a pretty regular distribution of positive and negative months.
It’s really those two outliers that spike the punch and the return distribution graph above shows that very nicely.
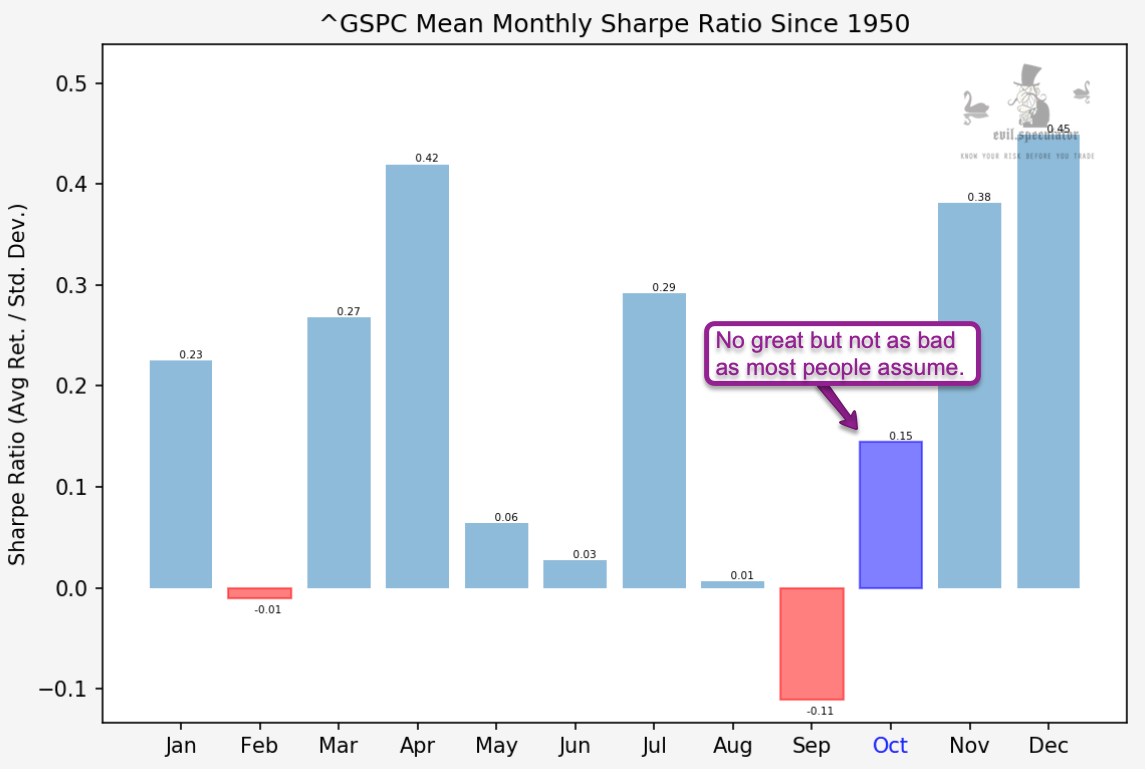
Which is why it isn’t overly surprising that October – on average – actually ends up in the plus. And once again, that reading would be quite a bit higher without the two infamous crashes.
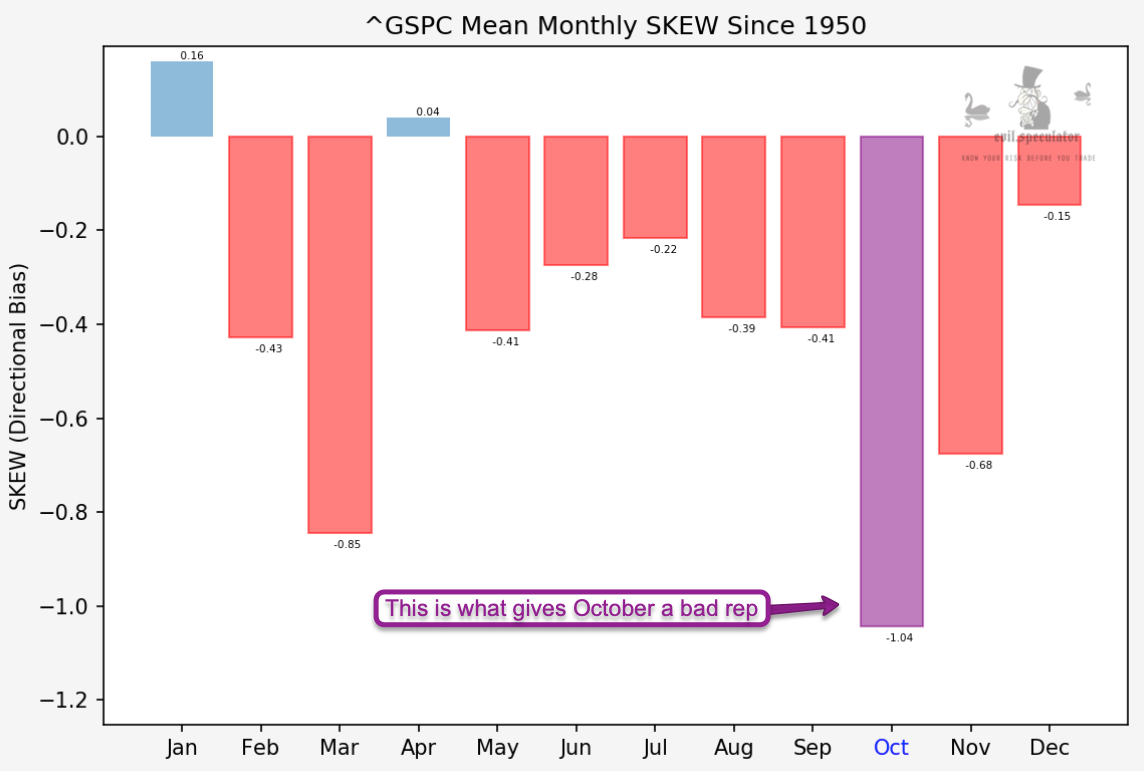
It may surprise you to hear that October – in fact – has the most negative SKEW of the year at -1.04. Which, if you’re not a stats aficionado – is actually a positive thing. And if you are then this may surprise you. It sure did it for me.
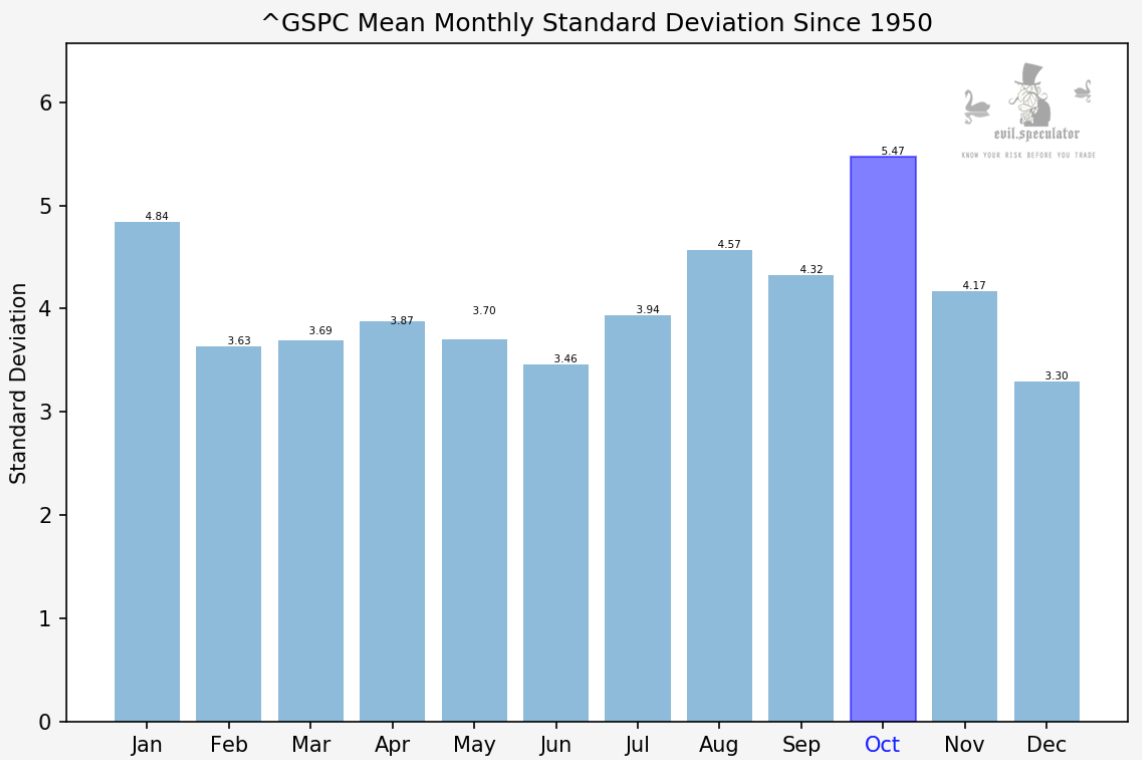
Of course I’m not going to sit here and tell you that October is an easy month to be active, even as a savvy experienced participant. Standard deviation is elevated and would be even without those two crash years.
In case you didn’t pay attention in great school math class – standard deviation is a measure of the amount of variation or dispersion within a dataset. If you take another peek at the very first chart I posted above then that becomes abundantly clear.
More nerdy statistics and important pointers for not blowing up your account this week below the fold for my intrepid subs:

It's not too late - learn how to consistently trade without worrying about the news, the clickbait, the daily drama and misinformation. If you are interested in becoming a subscriber then don't waste time and sign up here. The Zero indicator service also offers access to all Gold posts, so you actually get double the bang for your buck.
Please login or subscribe here to see the remainder of this post.


