


Traversing The Valley Of Volatility
Traversing The Valley Of Volatility
Just oooking at equities these days is giving me headaches. We haven’t seen ugly tape like this since the big shake out back in late summer of 2015 which ran all the way through Feb/March of 2016. After 20 months of bullish bliss we have now returned back to the murky valley of volatility with all its trappings of a corrective sideways periods: overlapping bars with long wicks, turns on a dime, fast stop runs, reversals followed by reversals, etc. etc. Who can make sense of it all? Well, I think I am just the market mole to do it, so read on.

Okay, this is what we’re dealing with right now. A there month churn that has us bouncing within an ever compressing range. Although annoying it’s a good thing as it shows that realized (and to some extent also implied) volatility continues to decrease.
Until we see a clear breach of a major spike high (right now that would be ES 2723) directional plays are off the table and have been replaced by swing trades. We’ve been holding up pretty well over the past few months but it is getting a bit tiresome to be honest.
Implied Volatility
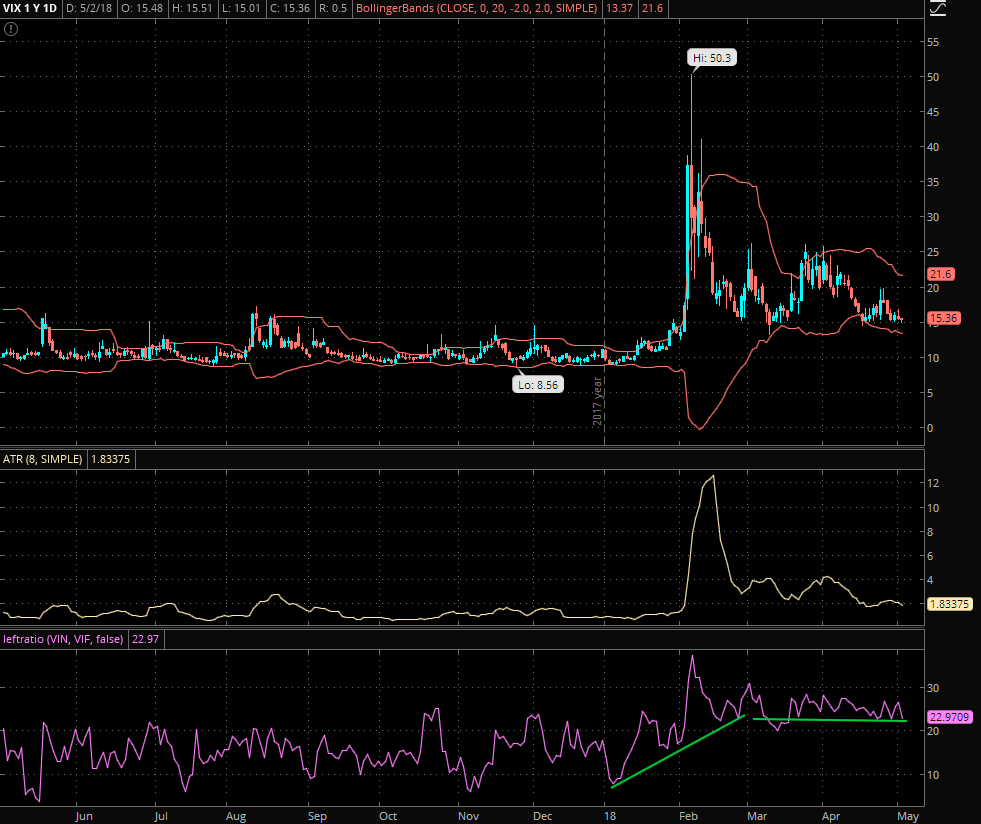
IV was on a rise in January which gave us plenty of warning that some nastiness was around the corner. Now however it seems to have plateaued around the 15 mark and that’s really where the rubber meets the road.
As long as the bulls keep missing short squeeze opportunities this is exactly the threshold from where bear attacks are going to be launched. Break this pattern and bullish tape is once again on the table.
You may notice that I’m using the VIN/VIF in the lower panel – both are components that comprise the VIX and I recommend you read up on them. The ratio gives me a wee better understanding of how IV is being priced across the two nearest weekly SPX option chains.

Now the IV term structure is still in bullish territory and actually flagged a bull signal back in mid April. What did we get? More swings to the downside. Which is the exact inverse of what we saw since the end of the big 2015 shake out.
The red box shows us one a period of historically low IV which kept getting ignored for almost two years. Now we are starting to whipsaw in an elevated range which may become the new normal for the remainder of this year.
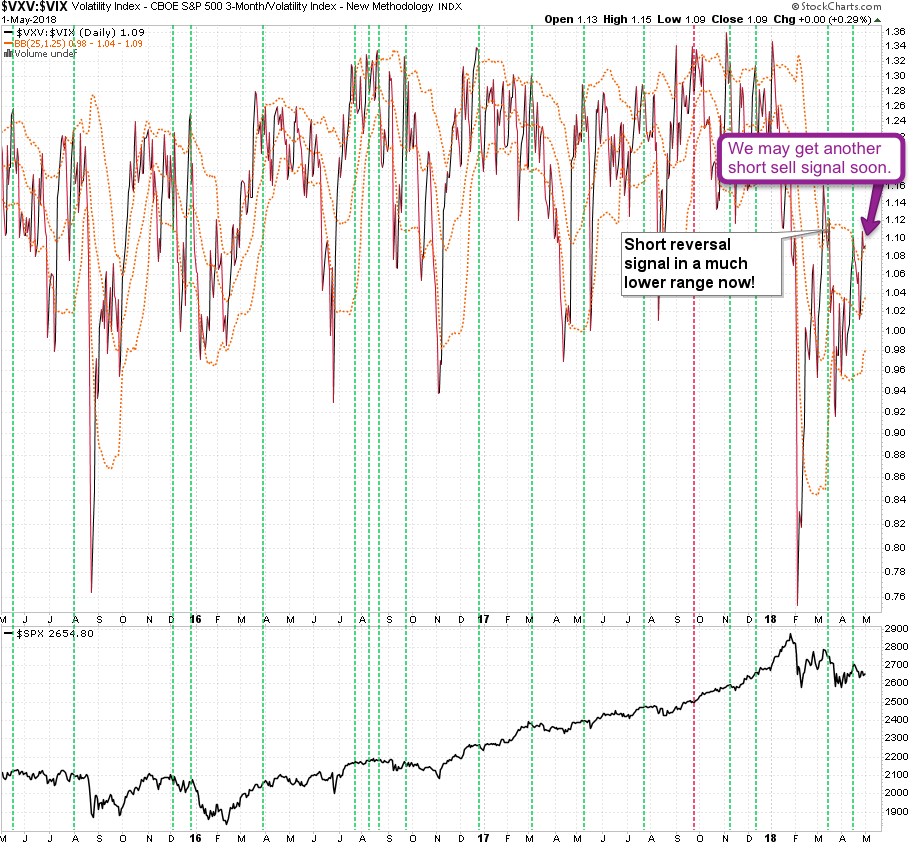
The same ratio but inverted and wrapped in a fast BB. I use these for short reversals and they have been working pretty well even over the past few years, which is saying something.
Well, it’s now very close to flagging another short signal UNLESS the bulls manage to drive this signal higher – much higher. Which may also get us out of that upper whipsaw range in the previous chart we are slowly starting to build. And that would mean quite a lot more pain to come, just like in late 2015 and into early 2016.
Quite a bit more below the fold – please meet me in the lair:

It's not too late - learn how to consistently trade without worrying about the news, the clickbait, the daily drama and misinformation. If you are interested in becoming a subscriber then don't waste time and sign up here. The Zero indicator service also offers access to all Gold posts, so you actually get double the bang for your buck.
Please login or subscribe here to see the remainder of this post.
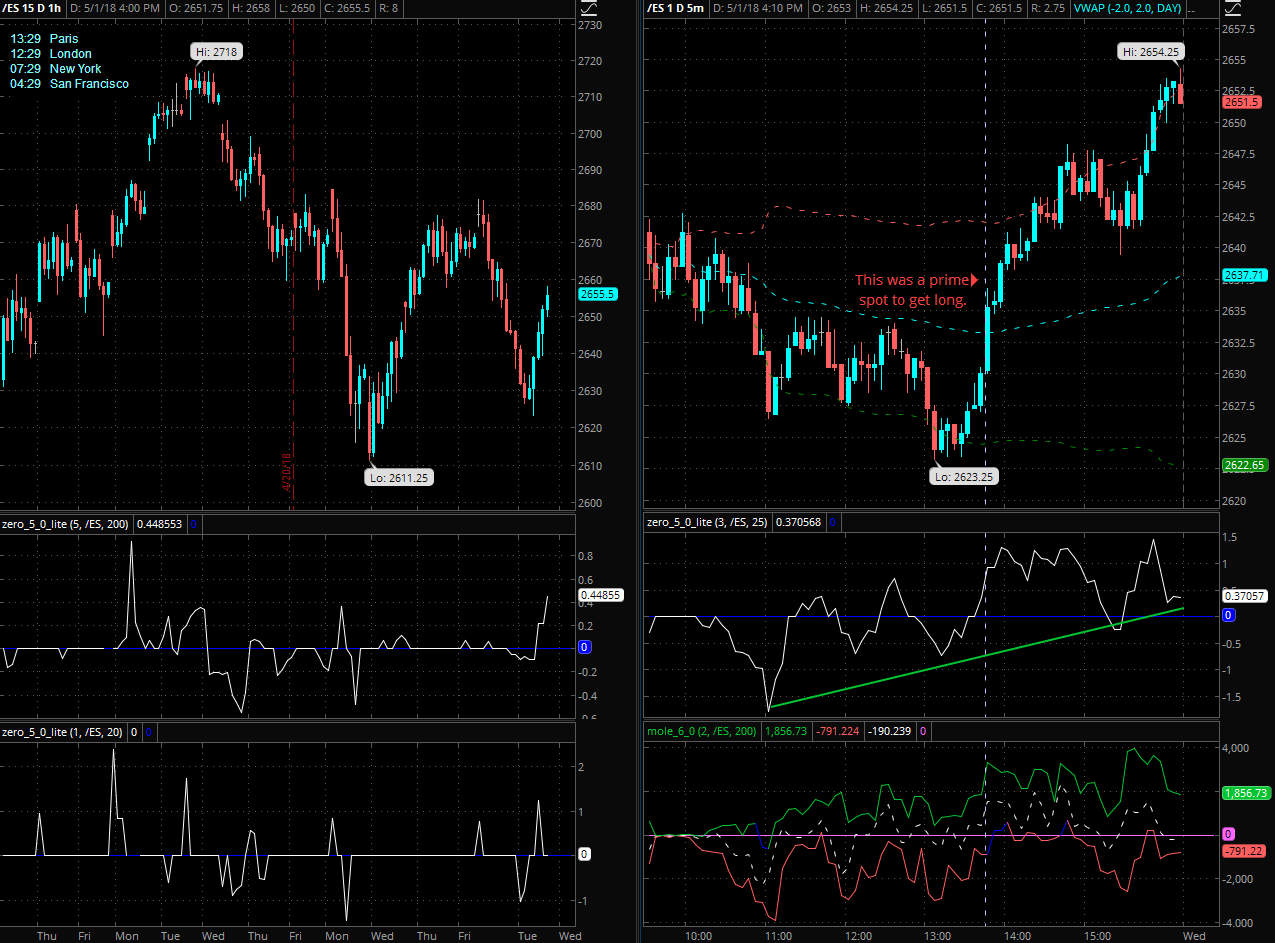
Talking about playing the swings (sub section) – if you were a Zero sub then you may have gone long after recognizing a textbook bullish divergence on the right panel. I’ve marked the spot where I would have taken it, unfortunately I was however occupied with family matters.
If you pulled the trigger yesterday then I suggest that you advance your stop to break/even. If you haven’t then I would discourage you from chasing the tape higher right now.
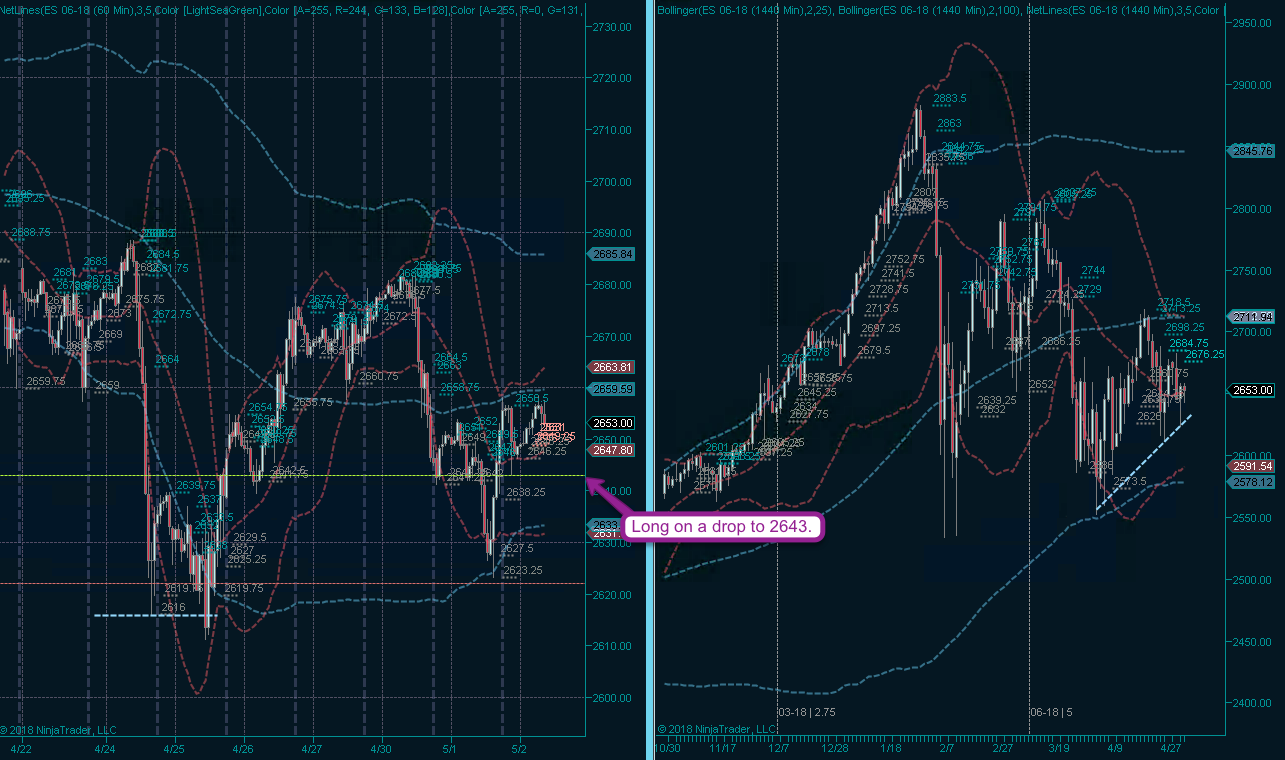
Missing out on yesterday’s intra-day entry means that I am now relegated to either missing out on a punch higher or waiting for a dip lower toward ES 2643.
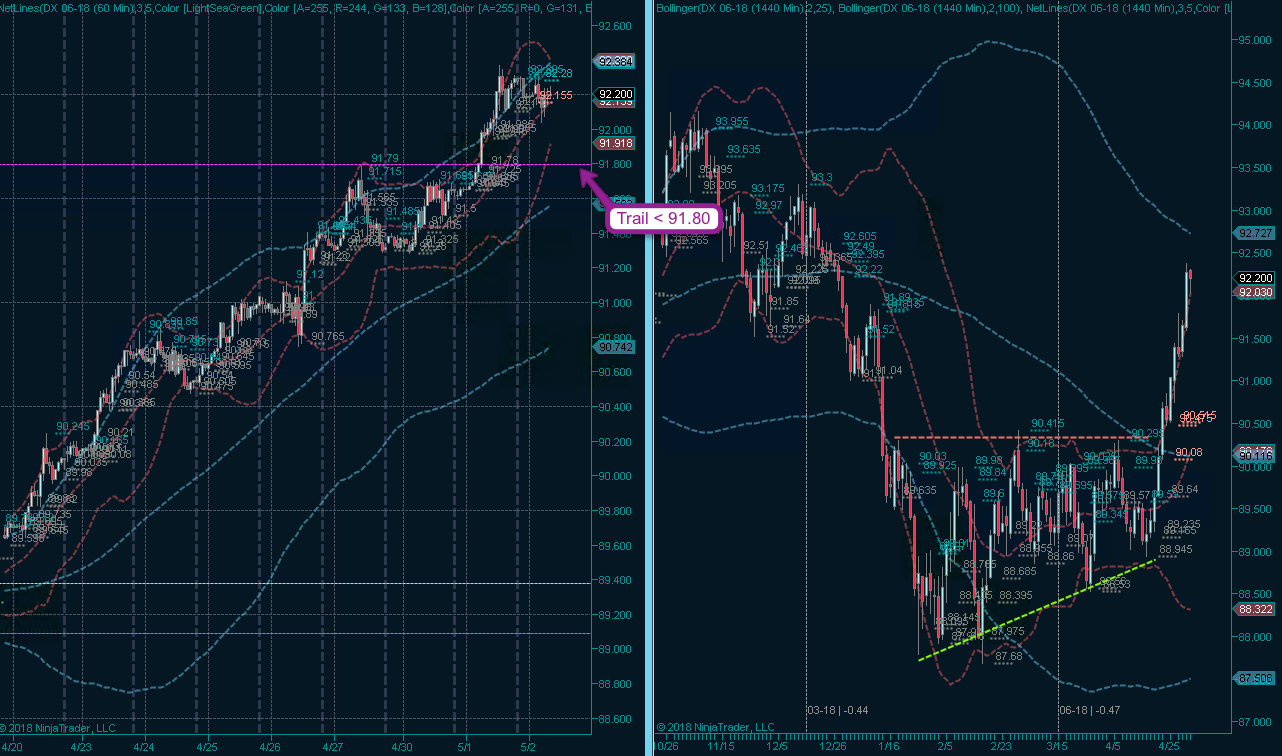
And that’s fine because I’m making too much ill-gotten gain in the USD right now. My trail has now been advanced 8R plus – with perhaps more to come. My target here remains the 92.5 mark plus minus a few ticks.


