


You Only Have Yourself To Blame
You Only Have Yourself To Blame
I know – great timing on calling in sick on a sell off day like yesterday. But in my defense, the possibility of a pending medium term correction was discussed in rather exhausting detail in last Friday’s momo update. So plenty of ahead warning and if you cheaped out of a membership and blissfully bought the dip again on Tuesday, well then you only have yourself to blame.
Now I wish I could tell you that I feel a lot better today but unfortunately this is not the case. Which is why I am going to keep my commentary to a minimum and mostly speak in charts (update: of course that didn’t work out as planned – LOL). Of which I have plenty of course as I thought it would be a good idea to show you leeches what exactly you missed out on last Friday.

Tuesday I told you that I was done with BTFD after having been stopped out of two lottery ticket longs. My point in essence was that going forward price had to lead the way by breaching over the then significant ES 2900 inflection point, which was touched later that day but produced an instant reversal lower.
Overnight trading produced additional selling which only intensified yesterday afternoon, in the end resulting into an > 830 point loss on the DJIA and a drop of over 100 handles in the (much more significant) SPX. Which incidentally appears to be followed currently in early trading, so we may not be done just yet.
As we speak Dow futures are down over 350 points, which may be an attempt to scare the children but technically speaking there is very little to hang our hats on right now when it comes to BTFD opportunities.
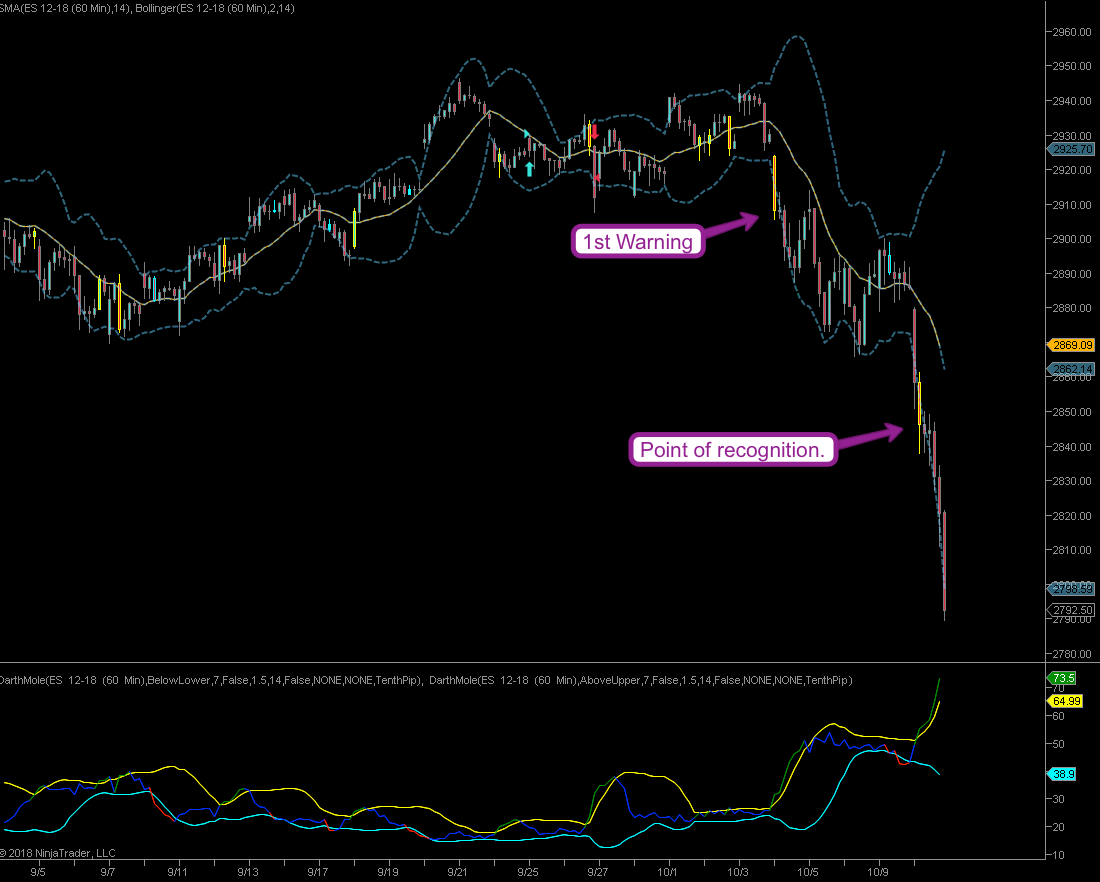
Very much worth noting are two consecutive buy signal failures on the realized volatility indicator. One failure means that a short term correction isn’t done just yet. Two mean you’re probably heading into a medium term sell off.
Okay, let’s talk momo – what follows is a revisit of the material I covered in last Friday’s post.
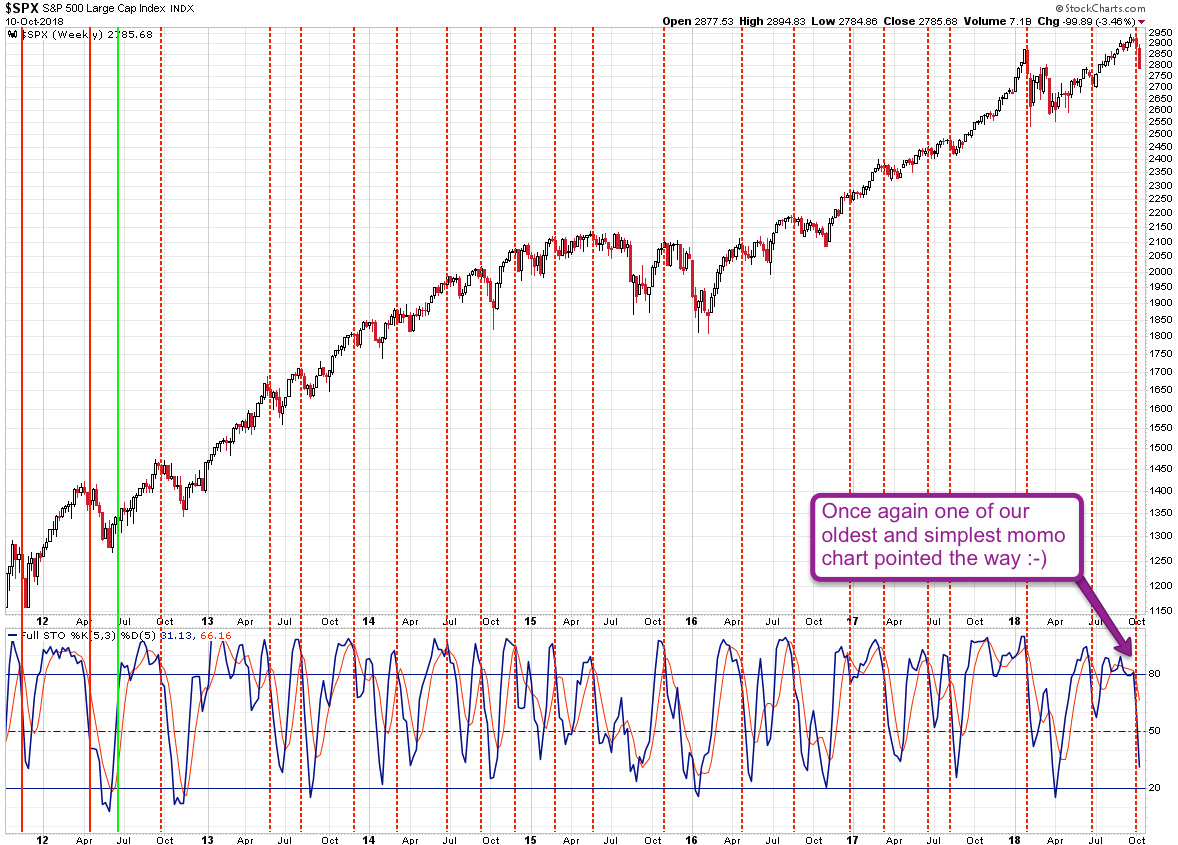
And once again it was one of our oldest, simplest, but most reliable chart that pointed the way: our trusted weekly stochastic, it’s the gift that keeps on giving. If nothing else it has kept us out of several dozen bull traps over the past decade or so.
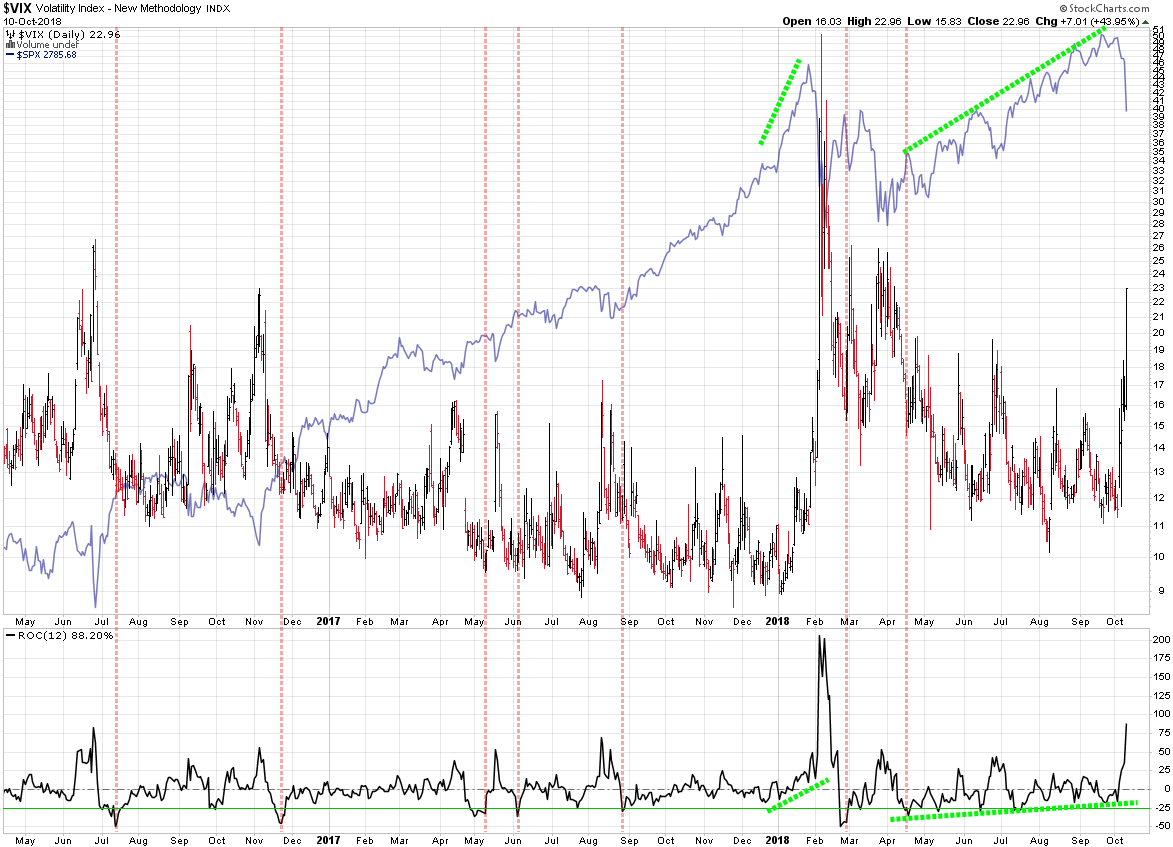
The VIX shown above has a tendency to produce cyclical spikes every six months or so. The wave of realized and implied volatility that follows usually subsided within a few weeks UNLESS it pushes > the 30 mark, in which case it lingers for a few months.
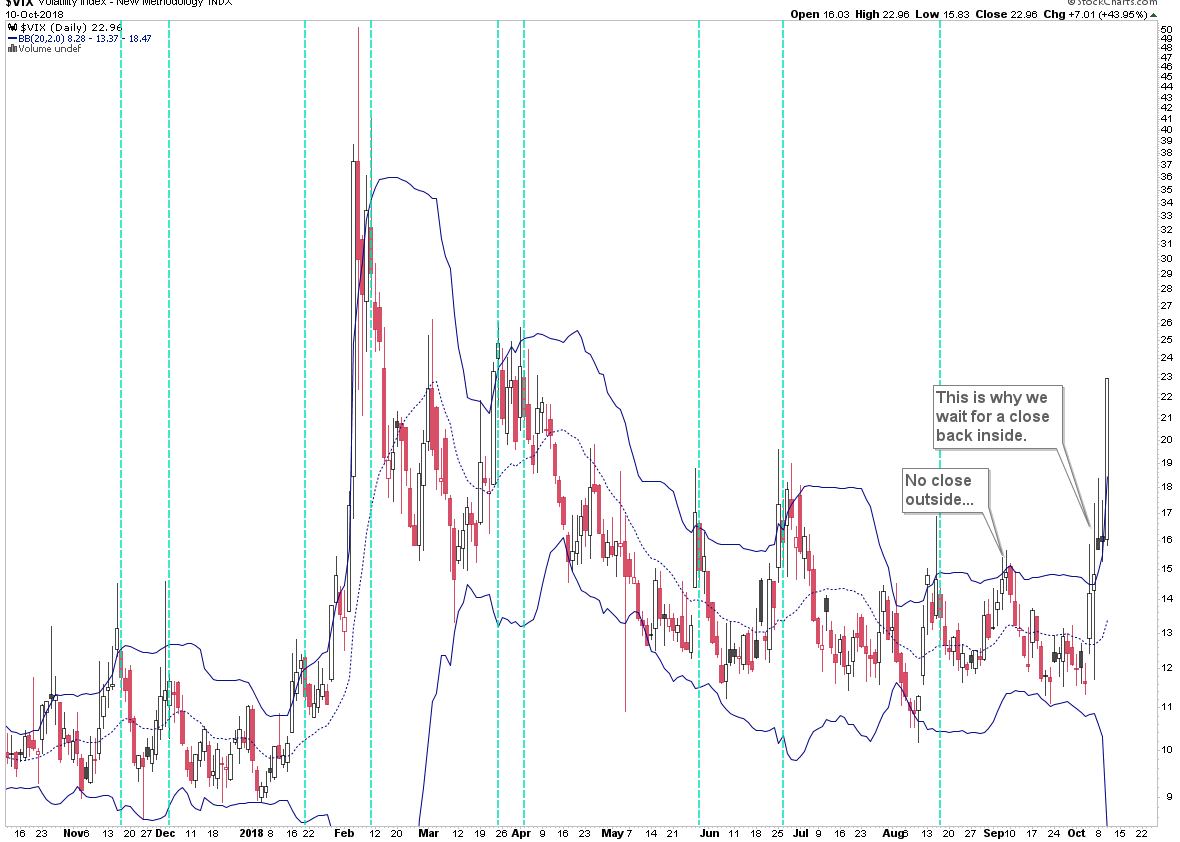
Here’s our VIX Buy Signal chart and I think makes it fairly clear why our rule set includes a close back inside the upper Bollinger and then an even lower close for confirmation.
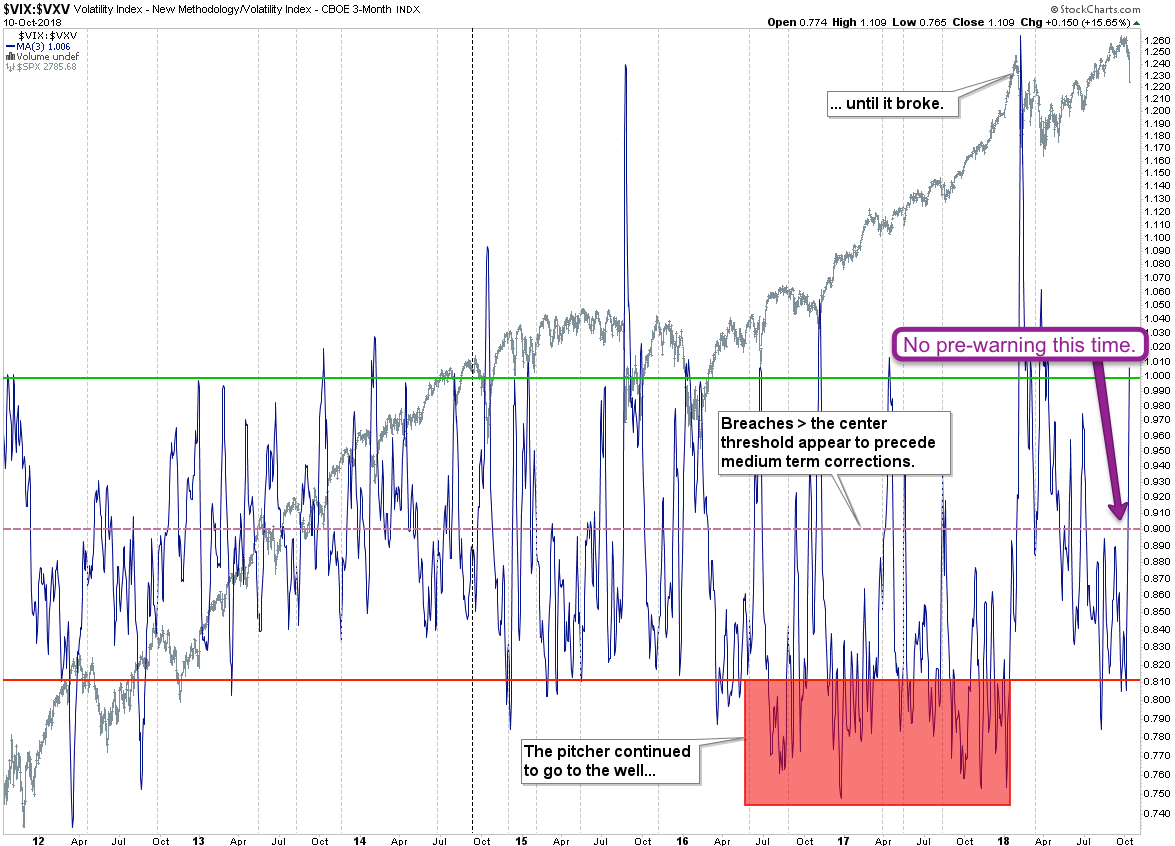
The Implied Volatility Term Structure (IVTS) did not give us a warning breach over the 0.9 mark this time. As a side note – during my work on VIXEN I actually discovered clear statistical evidence that market conditions change significantly beyond that threshold.
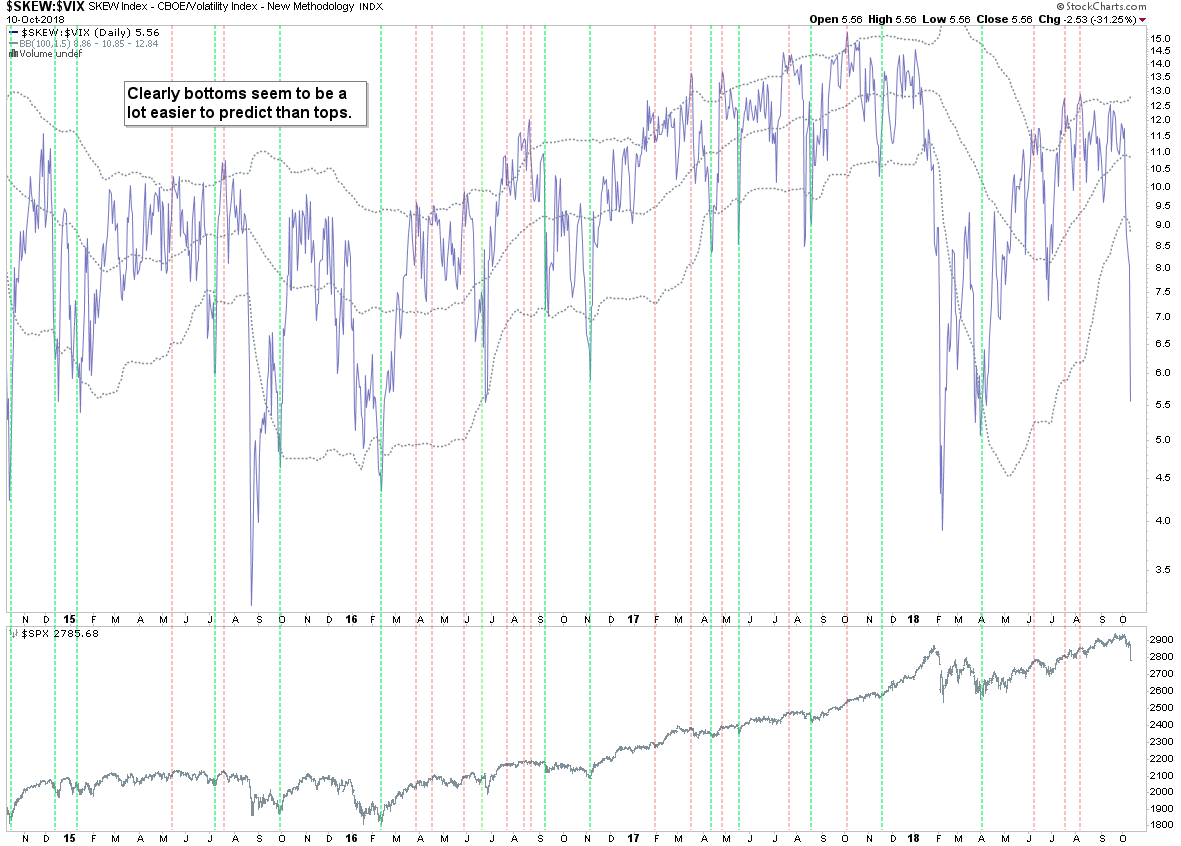
SKEW vs. VIX shows us something interesting however it’s very subtle. This time there was no pre-warning after several short signals were effectively ignored (only resulting in a small response lower in equities).
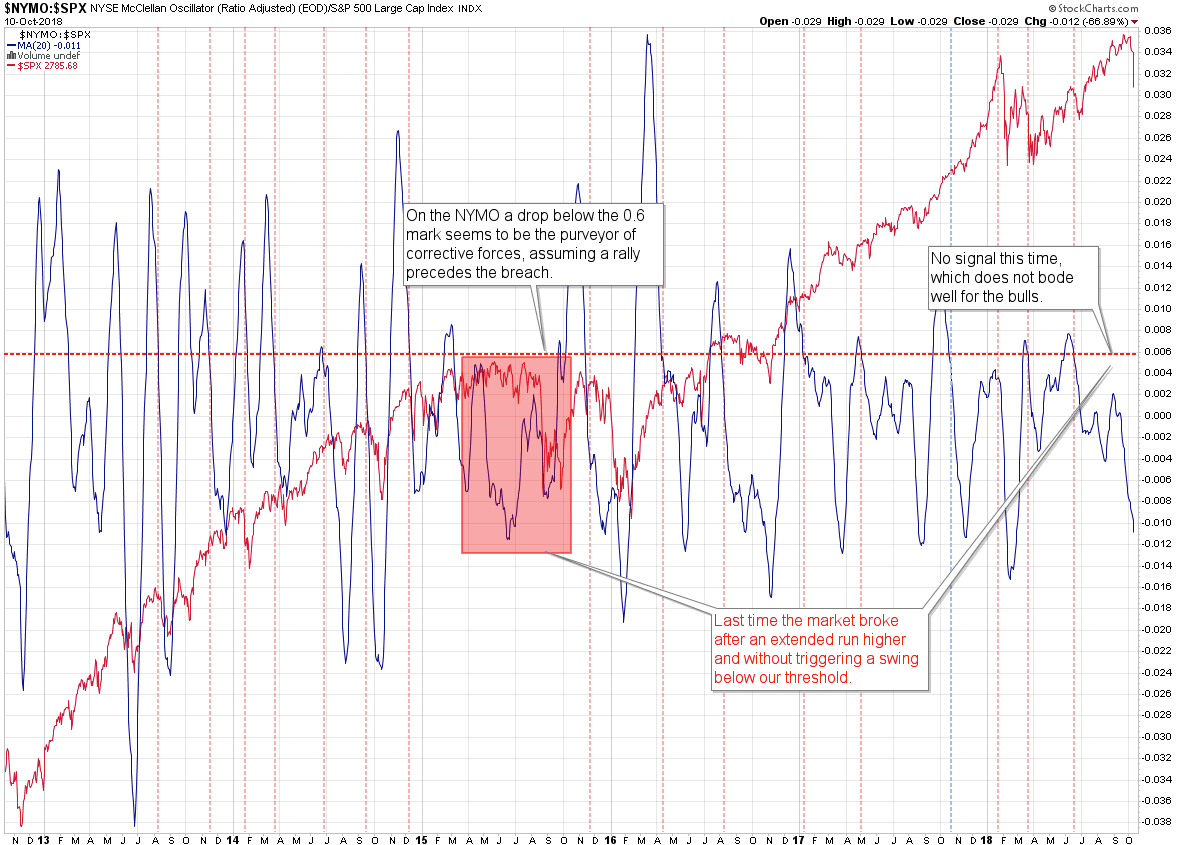
NYMO vs. SPX also produced a short signal back in June which was only followed by a humble dip lower. That’s fine and not necessarily bearish. What is however is that price continued higher unabated afterwards while the ratio continued to drop. Last time this happened was in spring of 2015 and we all know what happened afterward.
And understanding this is key as we may be looking at more than just a quick wipeout here after which it’s back to bullish business. Like on the SKEW:VIX chart extended bearish divergences often are followed by a wipeout and several months of continued volatility. Of course how this all fits into what traditionally marks the pre-Christmas buying season remains unclear at this point.
So you want to know if now is a good time to go long? For answers and more charting goodness please meet me in the lair:

It's not too late - learn how to consistently trade without worrying about the news, the clickbait, the daily drama and misinformation. If you are interested in becoming a subscriber then don't waste time and sign up here. The Zero indicator service also offers access to all Gold posts, so you actually get double the bang for your buck.
Please login or subscribe here to see the remainder of this post.


