


Tape Reading Without Indicators
Tape Reading Without Indicators
This is the fifth installment of an ongoing educational series that will cover the nuts and bolds of crypto currencies as well as the skills and knowledge required in trading this new asset class successfully over the long term.
BTC/USD is retesting the 10k mark this morning and on some exchanges even briefly dipped below it. ETH/USD has nearly been cut in half over the past three sessions, falling from slightly above 1550 to currently 860. And no better opportunity than a panic laden blood-in-the streets day for launching the next chapter of this series which will focus on tape reading and how to survive in the snake oil peddling casino that is the fledgling retail crypto industry.
I got into trading at the turn of the century around 2000 a little over a year before the dotcom bubble burst and took with the savings and dreams of millions of Americans. Retail trading was just coming into its own back then, now being able to take advantage of a host of new trading platforms that only a decade or two earlier would have been the envy of professional traders operating at any commercial exchange.
The proliferation of the Internet and massive growth in connectivity throughout the United States in particular for the first time offered regular Joes and Janes the possibility of placing trades quickly and efficiently based on up-to-date streaming information. What once had been the coveted domain of only a small group of professional traders or insiders was now suddenly available to practically anyone with a trading account and access to a computer at home or work if your boss was looking the other way.
It was all very exciting especially since the stock market continued to push up, up, and then up some more. We all felt invincible and were excited about such an unprecedented opportunity to make countless fortunes. And without doubt we would all be able to retire in style in just a matter of years, perhaps even earlier. Of course we knew that trading wasn’t easy, or so at least we were told. Plus if nothing else the stack of disclaimers one had to sign when opening a trading account served as a stark reminder of the potential risks at hand. But as always in the history of humanity greed and optimism prevailed and so a whole generation of Gen-Xers and not yet retired Baby Boomers dug deep and embarked on the gold-rush of a generation. Of course you know how it all ended up.
Sound Familiar?
Does any of that sound familiar, by any chance? If you’re a bit over 30 years old then I’m sure it does. Because there really is nothing new or unique about the current crop of miners, spectators, speculators, and adventurers embarking on what by overwhelming consensus is touted to be the opportunity of a lifetime. Instead of drilling holes into mountains or sifting through rivers the miners of today are crunching numbers in the bowels of rendering farms all over the planet. The spectators are cut from exactly the same cloth as the early pioneers of old and will always be eager to sell you shovels, easy entertainment, the occasional rumor, and enough rope to hang yourself with. The speculators aren’t wearing fancy suits this time around, but consider themselves to be smarter and more sophisticated.
After all this time its different because crypto currencies, we are all assured, are finally supposed to extract us from the clutches of financial tyrants and those evil banksters. At least that’s the sales pitch and it’s a pretty damn good one I must admit. A cause, a vision for the future, and an opportunity all rolled in one juicy package. Which is something I can most definitely get behind of and to be honest I already have.
Zero Sum Equation
But let’s be clear about this and at the danger of sounding like a broken record: Even if this crypto thing succeeds in the end it will come at a price. Because nothing meaningful or important in life ever comes easy or is given for free. The price that will have to be paid in the end most likely will be massive losses incurred by millions of impressionable small fish attempting to swim in waters traditionally dominated by large sharks and other creatures equipped to make quick business of anyone daring to venture out a little too far. The markets – any market, crypto related or not – in the end work on the basis of a zero sum equation. Which means for everyone who strikes it big, many others invariably must lose.
And losing is exactly what I ended up doing back when I just started out. And then once again in 2008 when the Fed decided to change all the rules overnight. In total it took me a decade and two major market crashes to learn how the game is played and then eventually how to thrive and profit as a trader. It’s been a long learning curve and a lot of work, but it changed me as a person – some even claim for the better. My mission since has been to help others avoid the same pitfalls as well as the trials and tribulations I had to figure out the hard way, mostly on my own.
The Trials And Tribulations Of Using Indicators
Now having set the stage a little let’s get back to today’s sell off. Blood is flowing in the streets and without having to look at my twitter feed I’m very confident that panic tweets are mixing it up with calls to HODL urging everyone that the next bounce is just around the corner. The question any red blooded trader invariably asks at this point is this: Do I buy the dip? And if so – why should I and when?
Well, have no fear – indicators are here! They’re integral part of any modern trading platform worth its salt plus over the past century thousands of books have been written about them. Technical analysis comes with indicators and you better know how to use them, right? And the more the merrier!
Unfortunately there’s one big problem with indicators that few if anyone will ever tell you about. Most of them don’t work or at minimum are lagging. And the ones which do work only do so on a part time basis, and of course you don’t know exactly when. I know all that must sound incredibly inane to you. After all I myself am known to use a mixture of Bollinger Bands and Moving Averages on a regular basis. So what’s the deal here?
The reason I get away with using a few select indicators is because I know how to read the tape without them. The ones I use are just additional abstractions that help me identify market patterns which are are purely price based. As such indicators only provide me with a lens through which I am able to more effectively identify price patterns. In the end however price is and will always be the ultimate denominator affecting your trading decisions.
I really need you to read the paragraph above at least one more time, as it is crucial for understanding any of the lessons in this series I will share moving forward.
But of course you don’t believe me and probably think I’m full of it. As a little exercise I have collected a few charts of today’s price action which I grabbed from various sites and trading accounts. We’re going to look at a daily series of BTC/USD – when possible I have added some of the default indicators offered by the respective trading platform. What I want you to do is to look at these charts and then tell me which of the indicators shown would help you trade in the current situation.
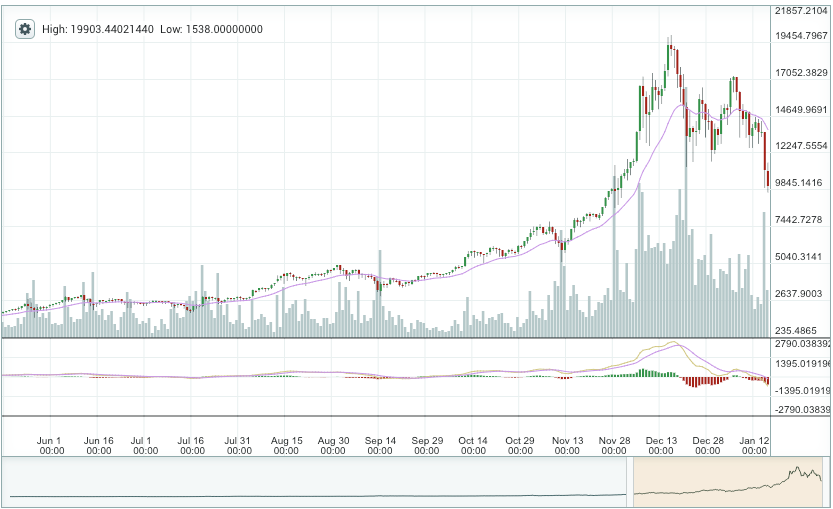
Above we have a snapshot of Poloniex earlier in the session when BTC was heading toward 10k and then dipped below. Not a happy day in the crypto universe and your job is to tell me when to buy that juicy dip. The indicators offered at Poloniex are scant, and I should say it’s to their credit but they probably don’t realize it and plan on adding many more in the future. The trading app racket is a constant arms race.
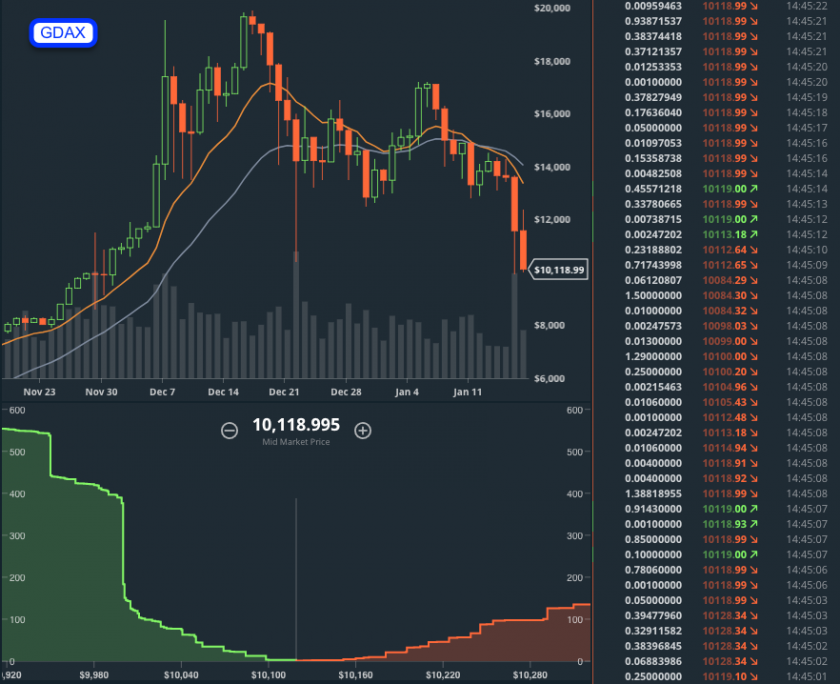
Next on the chopping block is GDAX. I’ve added two indicators I have often used in the past – the 25-day and the 50-day SMA. My question to you is whether those indicators tell you anything that price isn’t. For example if you look at the long series of higher highs and higher lows on the left of the chart which terminated in a spike high – that’s actually a pattern which can be used for long entries pretty reliably and has good probability. If you know how that is, and we’ll cover that here in the future.
The two moving averages on the other hand are just kind of dangling around right now. Both are pointing down now which suggests that momentum has flipped south but that’s something we knew already when price broke through the double bottom 13k. Much more valuable IMO and it’s purely price based. However, that said – I have a big beef to pick with candle patterns as well and we’ll cover that topic in the future as well.
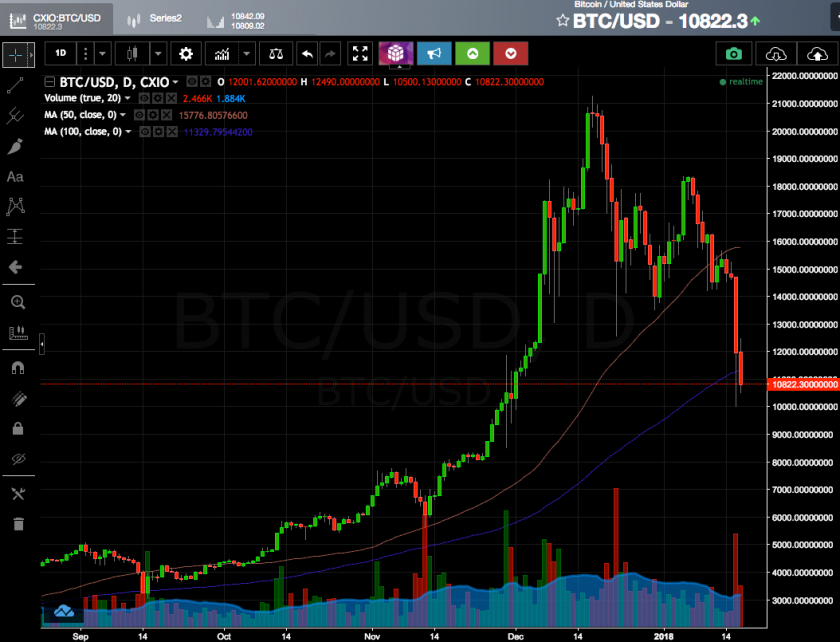
Here’s Coinigy which is becoming pretty popular, no doubt due to the rather impressive collection of trading tools they offer right out of a web browser. Once again I have dropped two SMAs – this time a 50-day and a 100-day. Full disclosure: I use them myself for visualizing trend patterns but I rarely ever buy a dip just because a moving average has been touched.
Look at the 100-day SMA. Well, we’re trading below it, don’t we? Why didn’t that one put up any support? What’s wrong with it? I tell you what – it’s meaningless right now because it hasn’t been observed since Napoleon was defeated at Waterloo in June of 1815 (don’t tell anyone – I’ve got short positions up the ass right now and the news haven’t gotten to Paris yet).
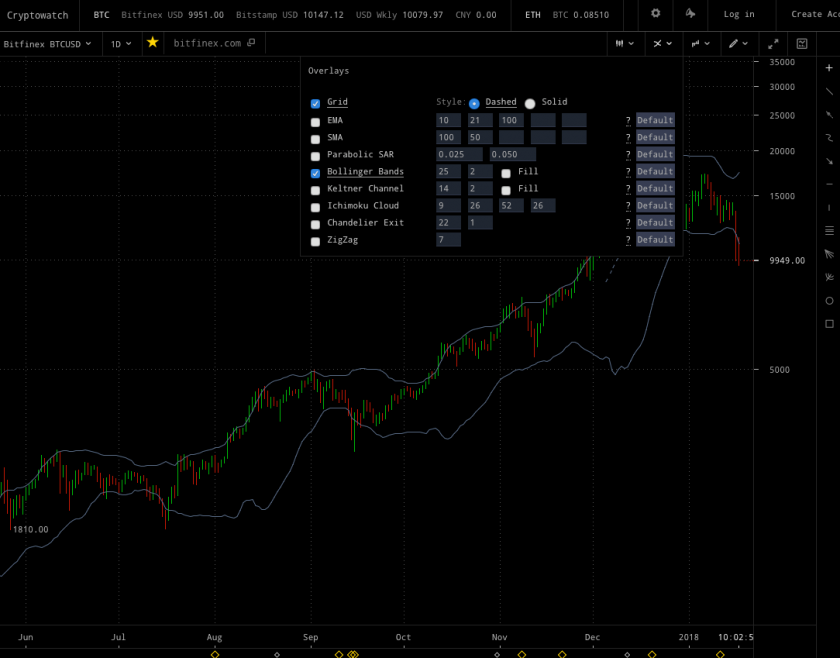
Finally here’s Cryptowat.ch which I really like from a design perspective. It’s minimalistic and that’s how charts should be. Price is the ultimate denominator and in most cases indicators are just getting in the way. At best they can help you develop a quicker sense of how price is behaving in regards to its historical mean after which continuing on its merry random walk.
One of the reasons I actually use Bollingers (based on standard deviation) as shown above as they help me identify mean reversion a little better. But a touch of a Bollinger band – on its own – has zero edge and that’s coming from someone who has run the stats and build several automated systems around them. In combination with an ensuing price pattern on the other hand they can be very extremely useful and the key to using them is to know how to read the tape on its own.

Don’t be the guy (or gal) that looks at charts like this at 2:00am waiting for one of the 200 trend lines or indicator thresholds on a chart to be touched. An overly rich diet of indicators may lead you into believing your own bullshit thinking that you may know something that nobody else knows about. After all you’re smarter and more talented than most anyone else, right? Yeah, to be honest that’s how I used to think as well a long time ago until Ms. Market taught me a lesson or two.
So What To Do In A Situation Like This?
Instead of relying on indicators we need price to show us that it may be ready to bottom out. We’ll never be able to pick the very low but we can get close enough by using price pattern analysis that has a statistically high edge near inflection points. It’s not a fool proof approach but it has worked for me over and over again for many yeas. Given the sell off in the BTC charts above however there is no telling how low she’ll go and when a major low will in place. For that we’ll need to look at several chart intervals in order to catch early signs of a bounce – the daily on its own won’t do. It’s another topic we’ll have to cover on another day.
Summary
Indicators can – in moderation – help you analyze price action more efficiently. But they should not be used as an excuse for taking out campaigns willy nilly, and the more of them you use the larger the risk of becoming religious about that one indicator that you think has special powers. And once you’ve drunk that kool-aid it’ll be impossible for anyone to convince you otherwise.
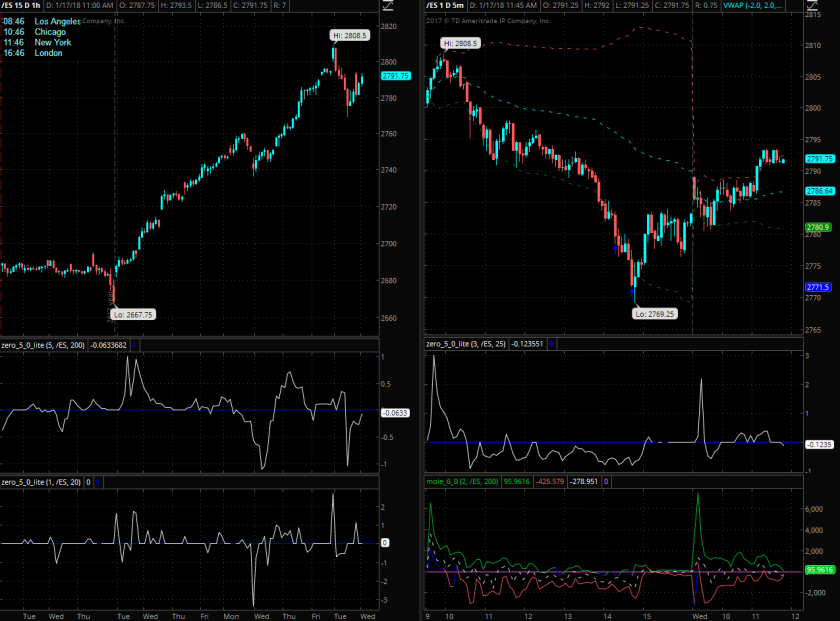
By the way, the Zero indicator I use myself on the E-Mini and have offered to my subscribers is actually more of an oscillator. It stands unique in that it is not driven by the underlying instrument. As such it is often leading instead of lagging. And it only works on the E-Mini (and nowhere else) by showing us stock market momentum via a mixture of exchange based momentum and participation measures.
The Zero usually tells me what makes the market tick and especially when short term price is momentarily lying to me. But nevertheless I would never take an entry just solely based on a signal on the Zero indicator. For that to occur price action needs to support what the signal is showing us – a pre-condition I make very clear in the tutorial.
In the coming installments of this series we are going to look at various common price as well as trend patterns and how to identify them. We’ll also mix it up a little with trading psychology and present common traps and how to avoid them. You will quickly learn that trading the crypto market is not too different from any traditional financial markets, although volatility and often a lack of liquidity seems to affect crypto traders quite a bit more. All the more important for us all to recognize tell tale signs of trouble that price patterns may offer us.


