


Living Inside a Broken Clock: Tuesday, Jan. 5, 2010
Living Inside a Broken Clock: Tuesday, Jan. 5, 2010
by gmak
Monday was another chapter of Ramp and Camp as all the action seems to take place after hours through pithy volumes in the futures. Dubai opens the worlds tallest building bringing back memories of the Empire State Building opening during the Great Depression. The ratios of Bulls to (Bulls + Bears) has not been higher in the last 20 years. The Treasury needs to borrow $136 bb between now and the middle of January. The SEC wants to regulate so that they can control when and if Americans can withdraw money from MMKT funds. PIMCO hesitates to buy anything as they see credit spreads widening. States are getting aggressive about troughing down on Treasury taxpayer dollars. The return from stocks for the last decade was essentially zero. Meanwhile, the MSM is more concerned about cleavage ratings than investigative journalism. Welcome to the broken clock.

EQUITY
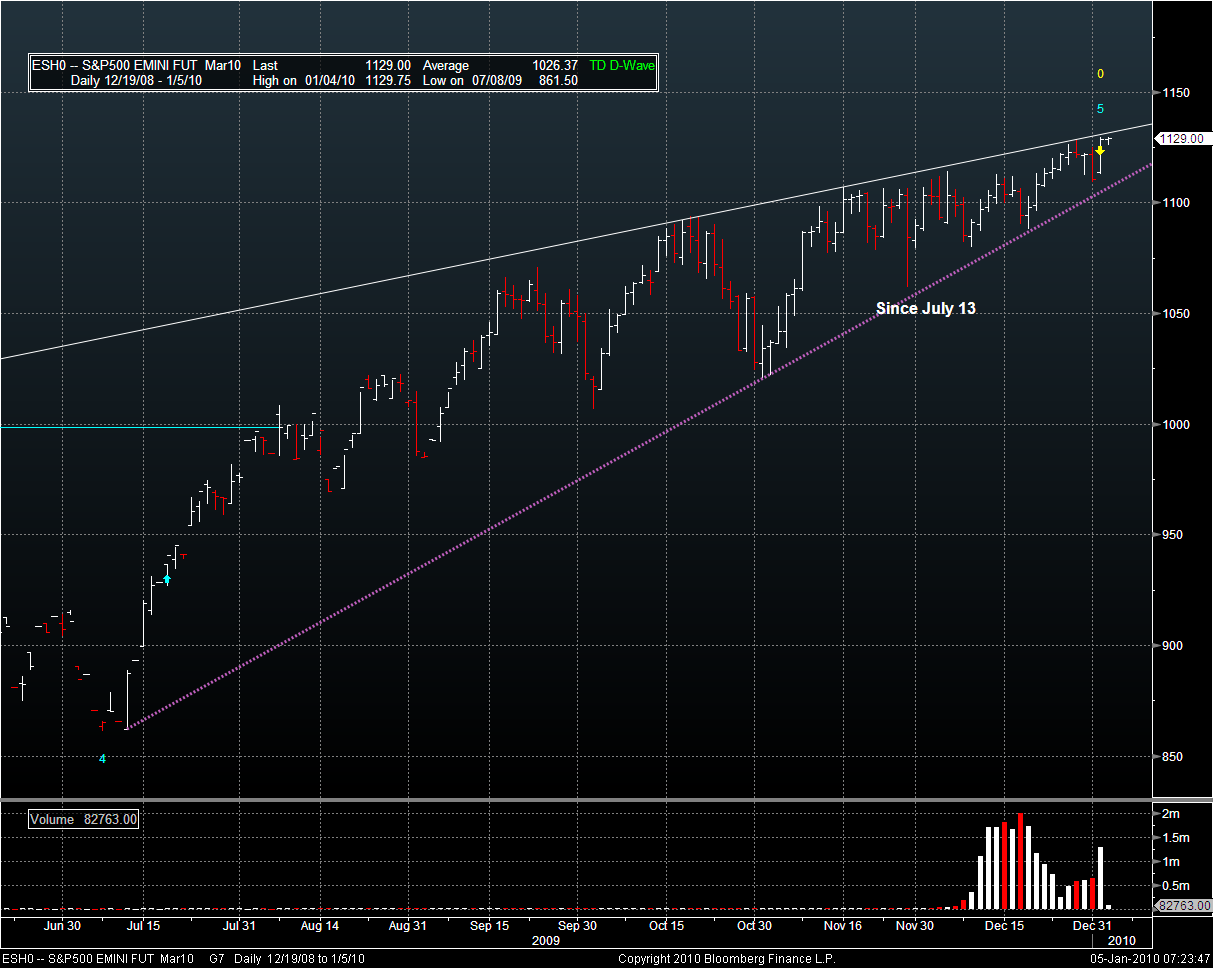
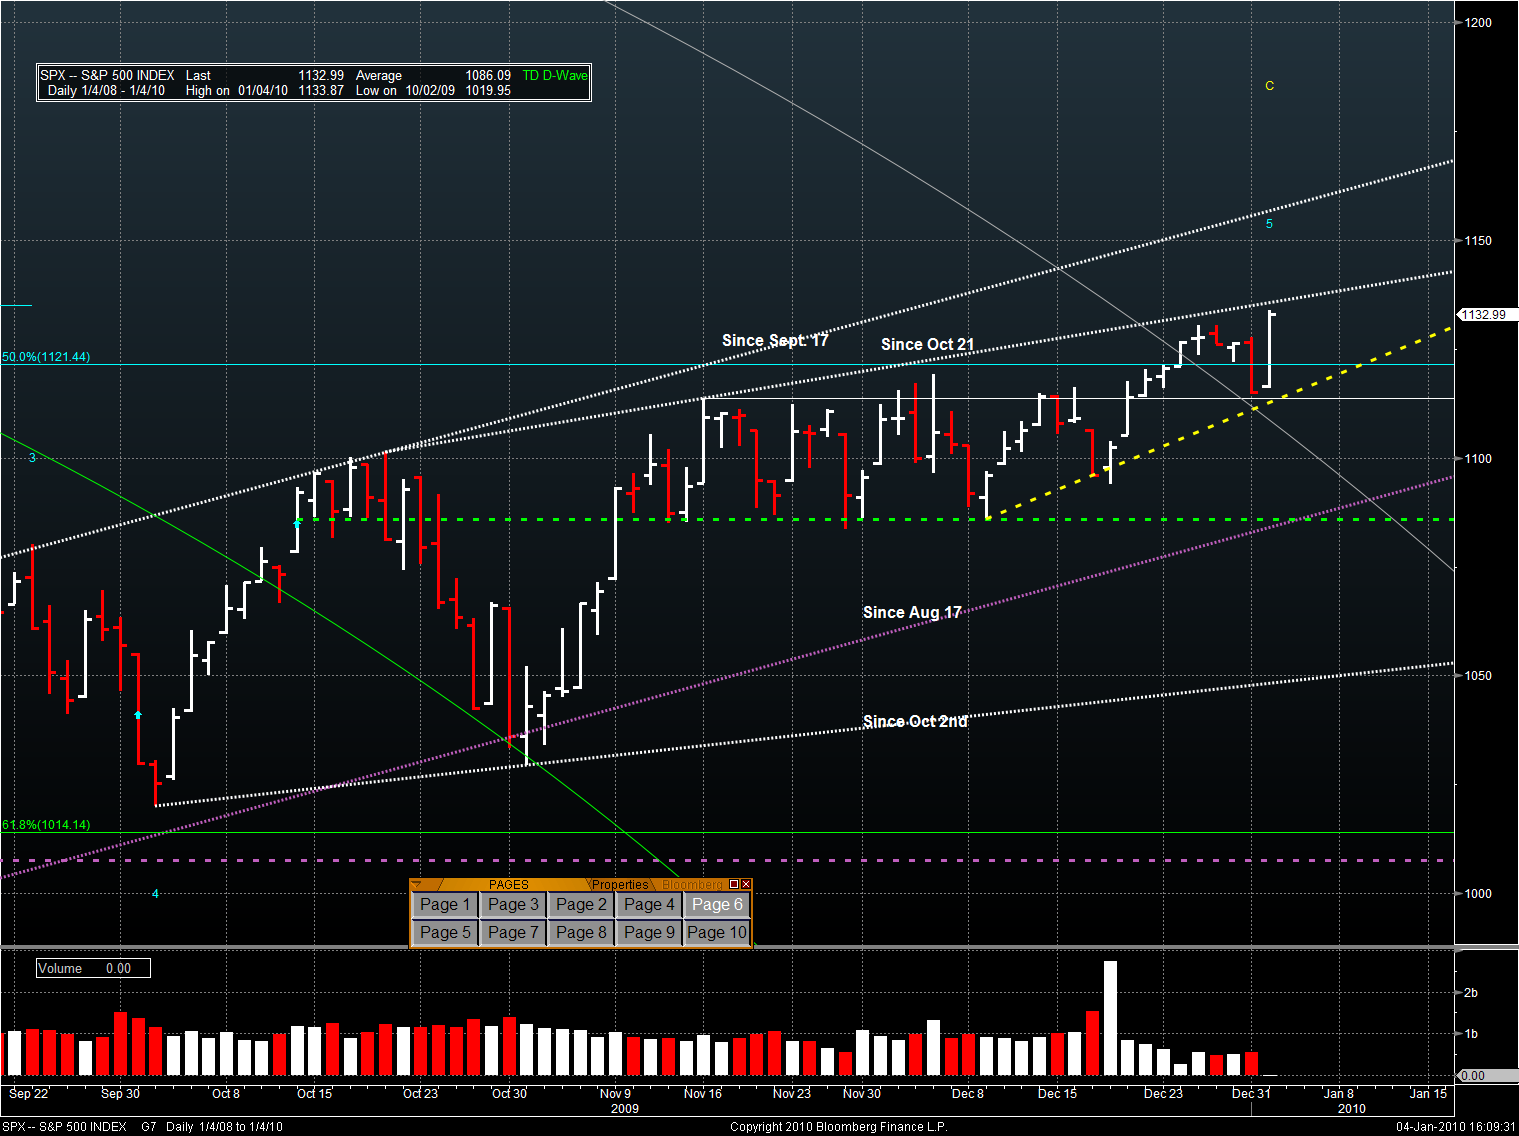
As you can see in the SPX daily chart, the trend line “Since Oct 21” is still in play. If you wanted to go short intra-day (I’m writing this just after market close on Monday), It would be a good idea to put a stop just above that trend line. The value on Tuesday is SPX = 1136.29.

Meanwhile, the world is green. In spite of how the bears feel, I think they would be better served going with the flow and playing long. Aftr all, would you rather be right or successful and rich? The easiest trading system in the world is to swim with the current with appropriate stops. Going long here on SPX would make me nervous, however, due to the prescence of the trend line just above. Today is probably a good intra-day scalping day.
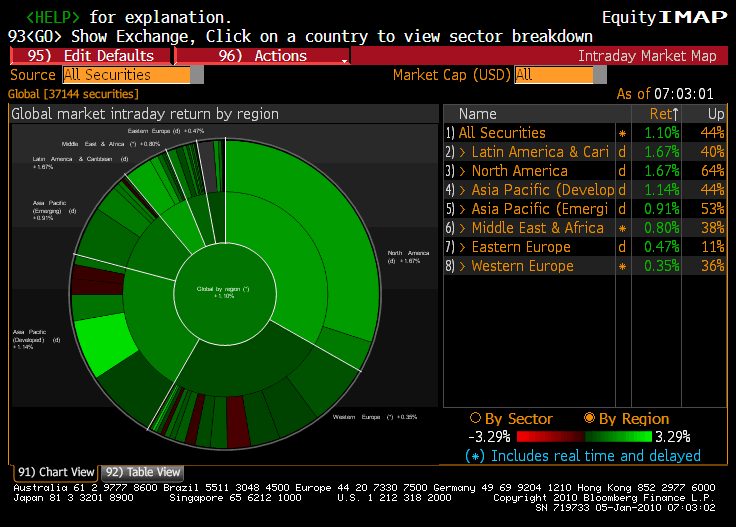
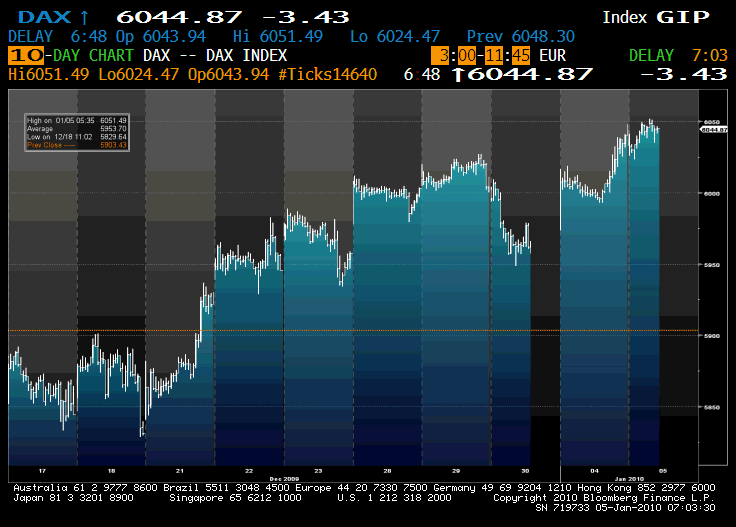
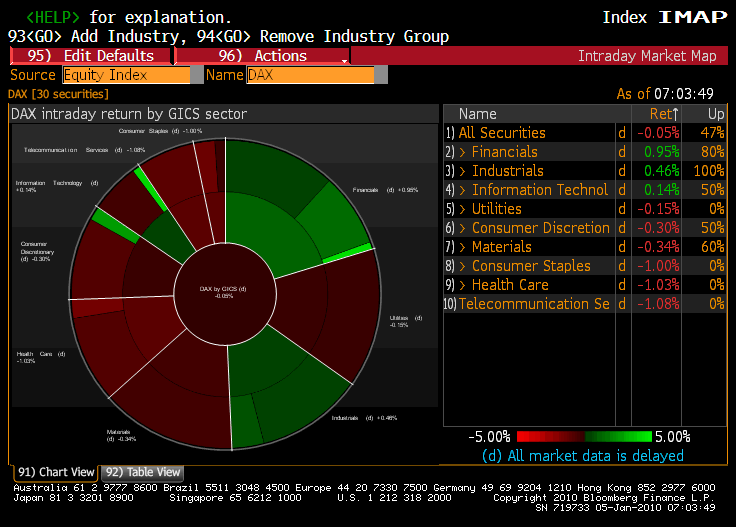
The DAX, after pausing for a day is pushing higher. But the leadership is coming from only a few sectors. Laying this against the overhead trend line on the daily SPX just reinforces my opinion that today is NOT a good “go long and sleep” day. ES is certainly not indicating any form of ramp and camp, even in the face of a weaker USD.
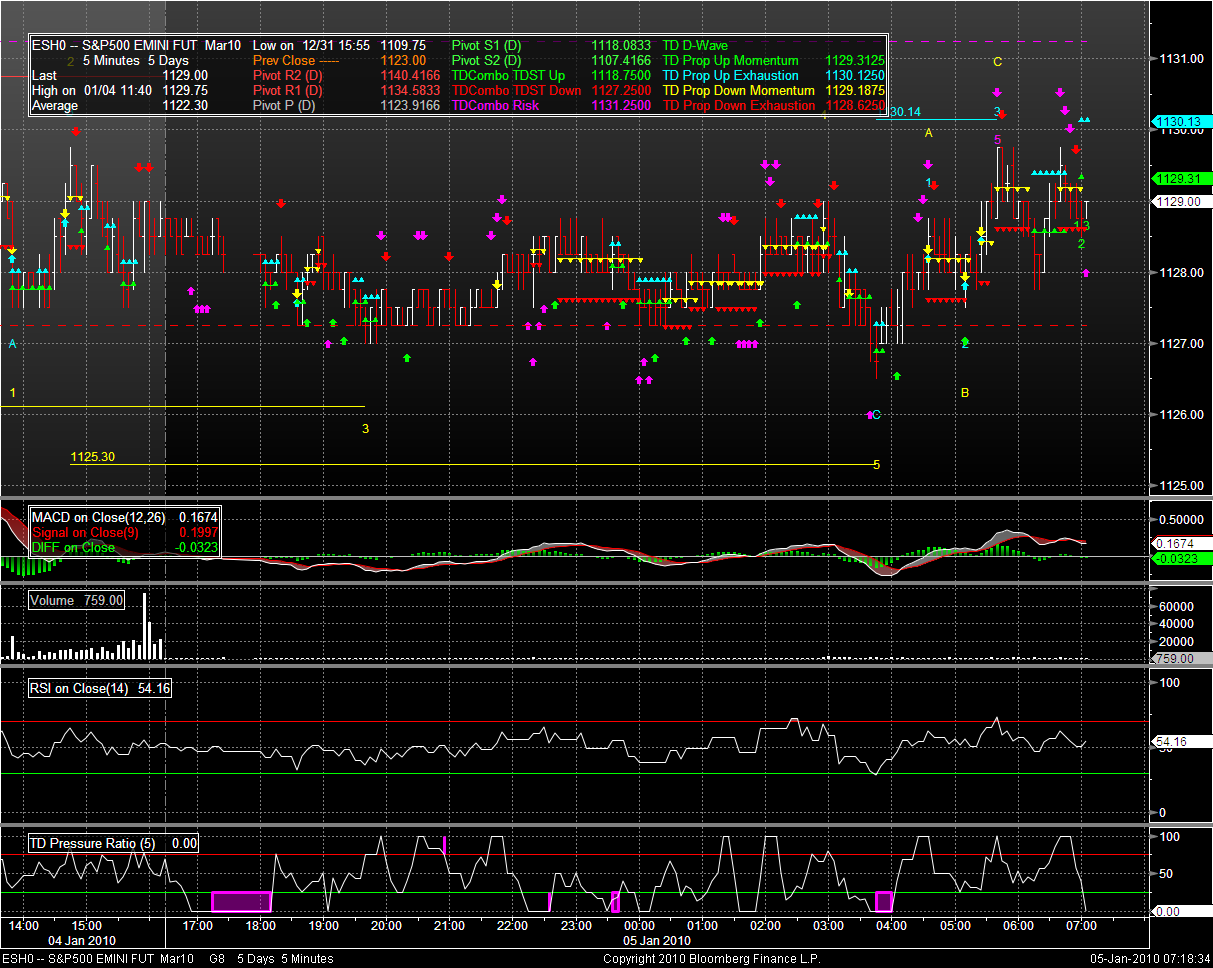
ES did in fact wander between the two TD risk levels that I commented on in CD’s post yesterday evening. I don’t know if there was any tradeable action in al that sideways movement. ES Pivots:
- R2: 1140 = would be a new high and the volumes don’t seem to be there yet.
- R1: 1134.50 = Volume and determination is needed to get past the TD risk leel at 1131.25. Given my assumption of the fear trade showing up in GOLD, I’m not sure that this can happen (wait until data at 10AM EST – it may provide some impetus in either direction)
- Neutral: 1124 = Will likely act as a floor if ES ever falls below the TD risk level at 1127.25 – there was a test around the Europe open but ES held up.
- S1: 1118 = was resistance on Friday and Monday. Probably would be a strong support, now.
- S2: 1107.50 = wouldn’t break the long term trend line since July 13th. Good place for a bounce as ES plays into the daily thin edge of the wedge.
The bears are right. This can only end in tears. But it would be sadder still to have an empty account when the moment finally arrives. The FED still has lots of funny-money to throw into the system – at least until March. When the trend is clear, swim with the current. When there is doubt, sit on your hands. It is better to wish you were in the market than to wish you were out.
FX
This daily chart of DXY shows how the USD is getting hung on resistance at the 23.8% FIB from the High in March to the low in Nov/Dec. Perhaps consolidation will happen here and it is a nice bullish flag forming. Perhaps the USD will get punished and fall back to 75. TD says that if 73.90 is breached to the downside (Purple dashed line), that there will be more pain. The TD wave count looks inconclusive (what else is news) but that the next wave should be up (after the blue ‘2’ or yellow ‘B’ – which could already be ‘in’).

A more detailed view shows how DXY is struggling to get back to its winning ways – and it looks a little heavy at the bottom of the current ‘flag’ – having a hard time staying above the horizontal trend line at 77.38. Still, given that DXY was down around 73 / 74 at the end of November, the USD has surprised and burnt a few johnny-come-lately shorts in that time frame. Now if someone could just explain why the CAD is on a tear, I would be happy. My guess is that it is anticipation of yield /rate increases – given the latest economic data and the consumer sentiment.
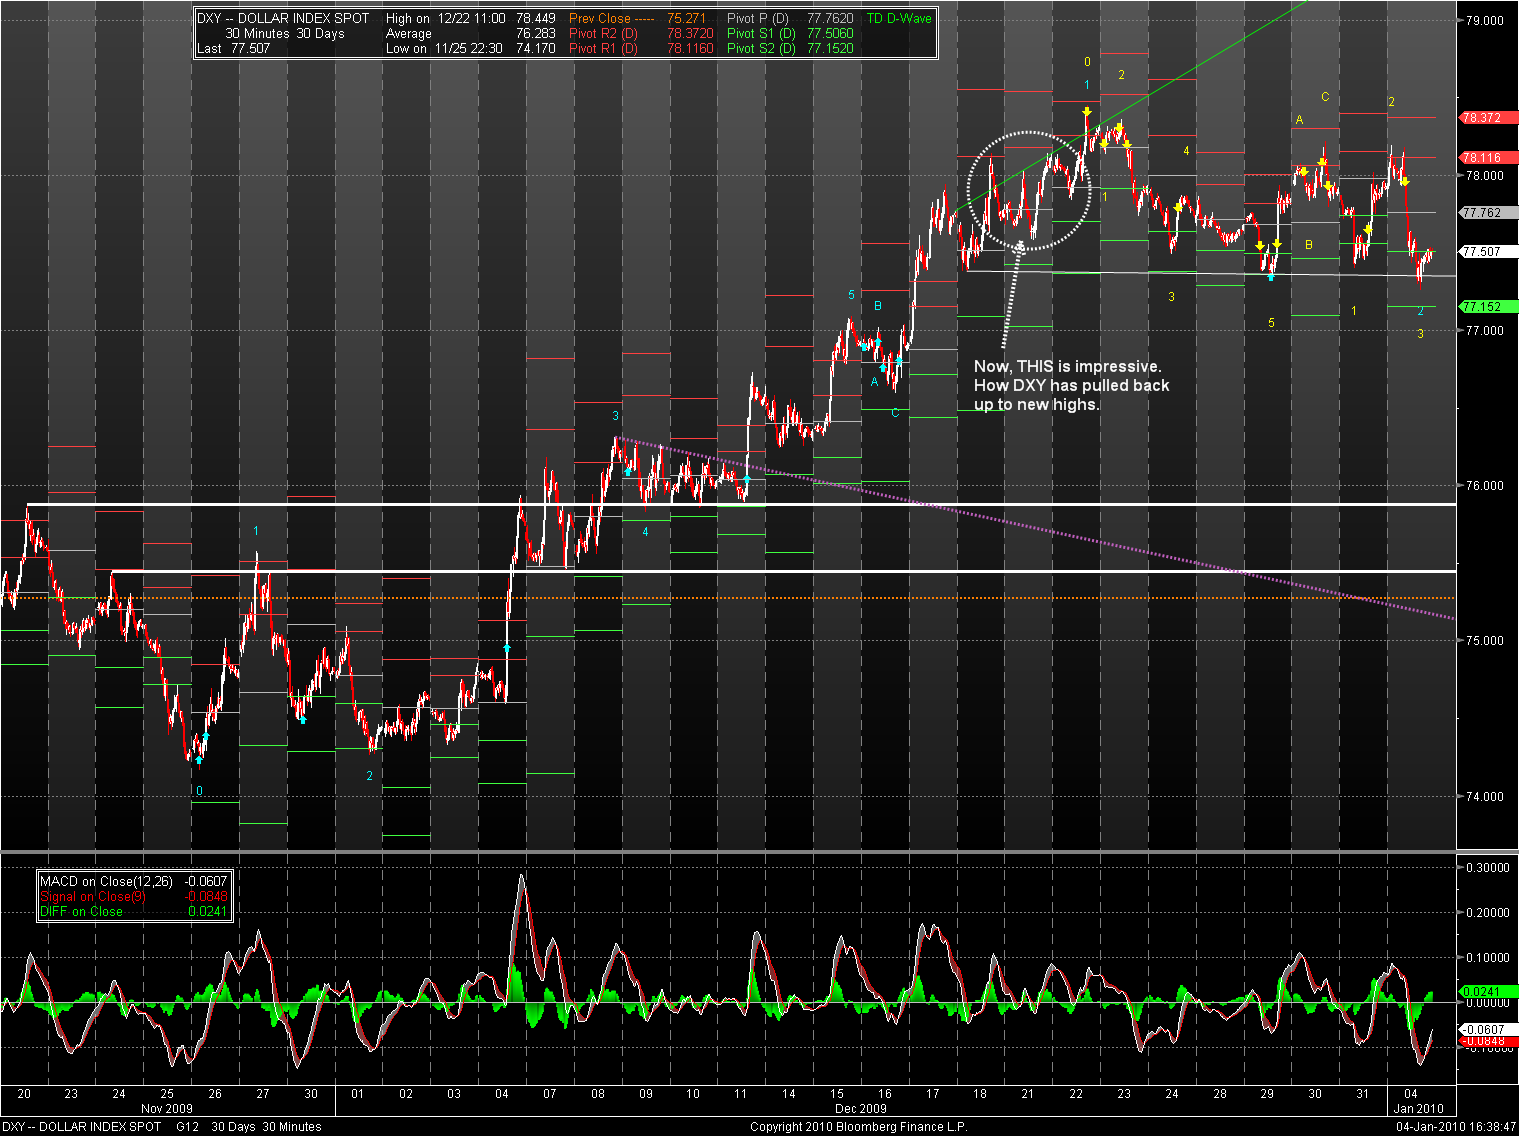
Here is the DXY this AM. As suspected, the support gave way. The recovery back up to support is interesting and begs the question: “Is it recovery (trend to continue up) or retrace (pride before the fall)?

And did you happen to catch the ramp in GOLD and pop in Oil? It seems that the oil trade is a speculative one from the cold weather and economic growth expectations. Is GOLD the fear trade? What are “they” afraid of? Is PHK really showing that the curtains have caught fire and that we can expect a rush to the exits over the next month? These and other issues are why it is best to be cautious on the short and long side, at the present time.
USD is weaker this AM. CAD, JPY, EUR are stronger. GBP is weaker. I don’t know quite what to make of this. It suggests that trading the usual correlations could be quite costly.
NEWS
DATA
TD TA is providing a nice sideways range with clear indications of where to put the stops (ES = 1131.25 above, and ES = 1127.25 below) – ES can exceed these, but a lot of momentum is needed to keep the trend going. If you want to swing trade or scalp 3 – 4 points, this may be the way to do it for the time being (into 10AM). Right now, ES is square in the middle – so it’s really a coin toss and not a good risk /reward setup.
Cheers.


