


Looks Incomplete
Looks Incomplete
It’s very tempting to start looking for long entry opportunities after a series of nasty sell off. Clearly there couldn’t possibly be more selling around the corner after an entire month of upside progress has been wiped out in a matter of days, right? WRONG. Gauging downside price action by comparing it with upside price action is a flawed perspective that has cost the trading accounts of a many traders.
Let’s do a quick refresher on some basic statistics. On average roughly 80% of all significant price moves occur in only 10%-15% of the time – that of course includes rallies as well as sell offs. And although not every single market is the same in general markets spend the vast majority of their time in clearly defined ranges until they suddenly shoot higher or sometimes start free falling lower.
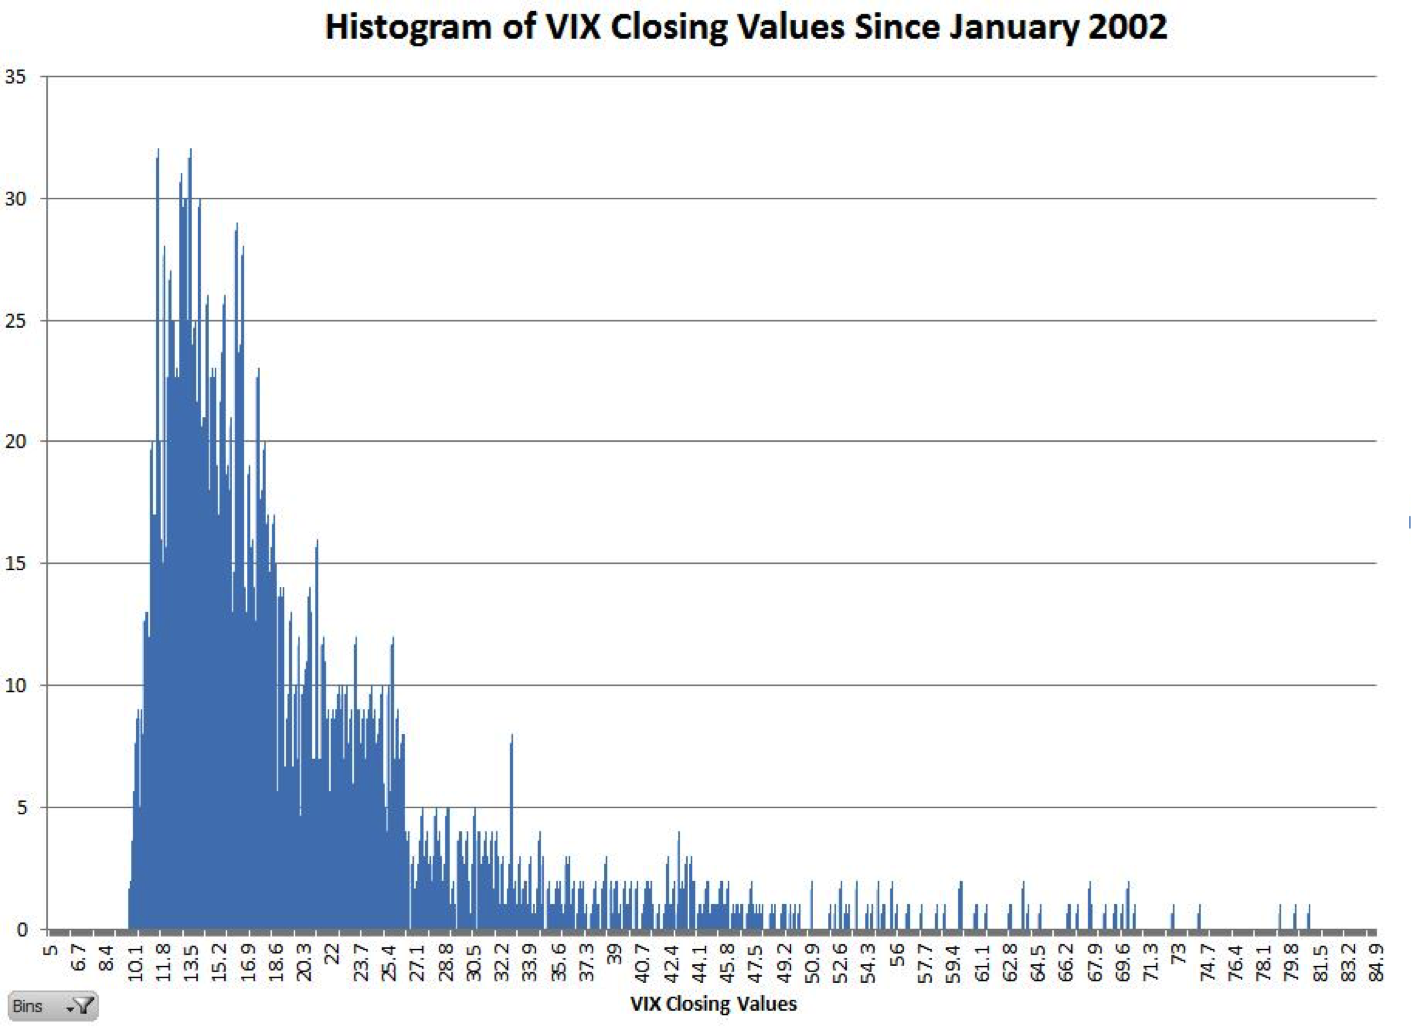
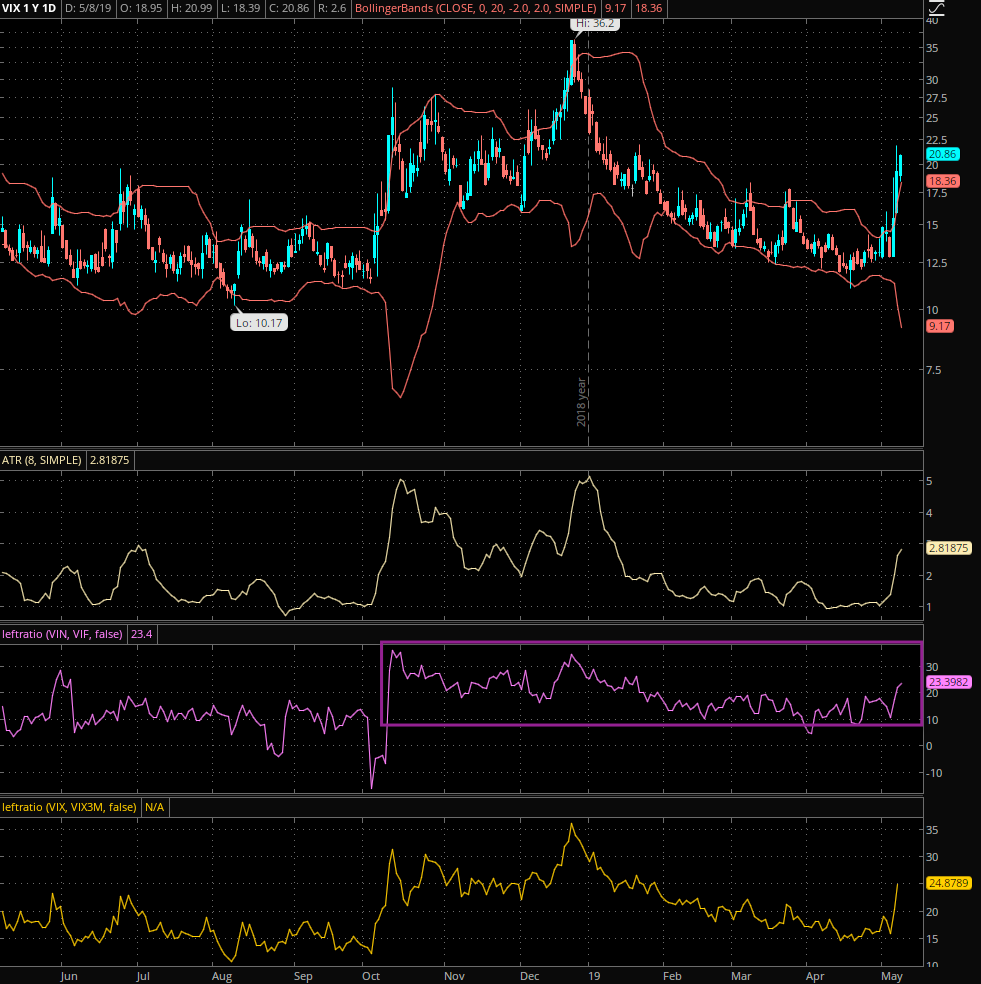
Now we know that sell offs usually produce quick spikes on the VIX, at least up to a certain threshold at which the VIX actually begins to move along with price (see Ken Long’s research on this) – this actually happens about 56% of the time.
I would say that anything > a VIX of 15 is starting to push into nervous territory – 20 is where it’s getting serious and anything above 25 is considered bearish with 30 representing the ‘everyone panics’ mark. But if you look at the histogram above then it’s clear that the VIX is spending a vast majority of its time between 9 and 17.
I haven’t run the numbers but after looking at this stuff for two decades I’d pose that this range probably covers about one standard deviation, which stands for 68% of the time. Push out to about 25 and that to me looks like two standard deviations, which of course stands for 95% of the time.
Now I’m pretty sure you already grasp where I’m going with this. At least two thirds of the time in the career of a trader is spent in either boring sideways or bullish tape. The remainder either covers small corrections during a downtrend or full scale sell offs.
I guess I could have just skipped all those stats and simply stated that our internal gauges are tuned for the majority of price action, which is either sideways or to the upside. We all know it but when the tape starts drifting lower we still perceive it in the context of what just preceded it, which most likely was a slow grind higher which perhaps toward the peak became a bit more volatile.
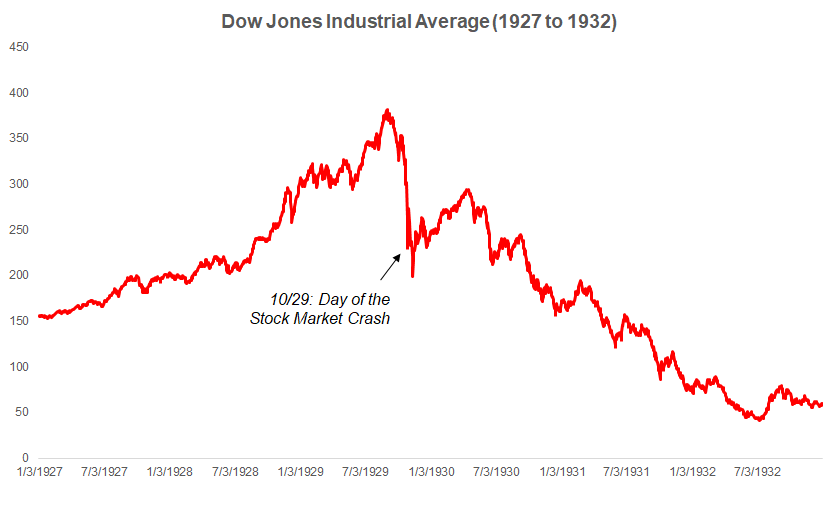
I’m sure you’ve all heard the expression: markets take the stairs up and the elevator down. Nothing new under the sun and all you have to do is to pull up a chart of the 1929 stock market crash. Admittedly what followed it was a multi-year sell off but again note that the legs lower are much more directional than the desperate attempts to paint a floor.
Must have been a rough time to be a trader. Hat tip to the ole’ boy plunger.
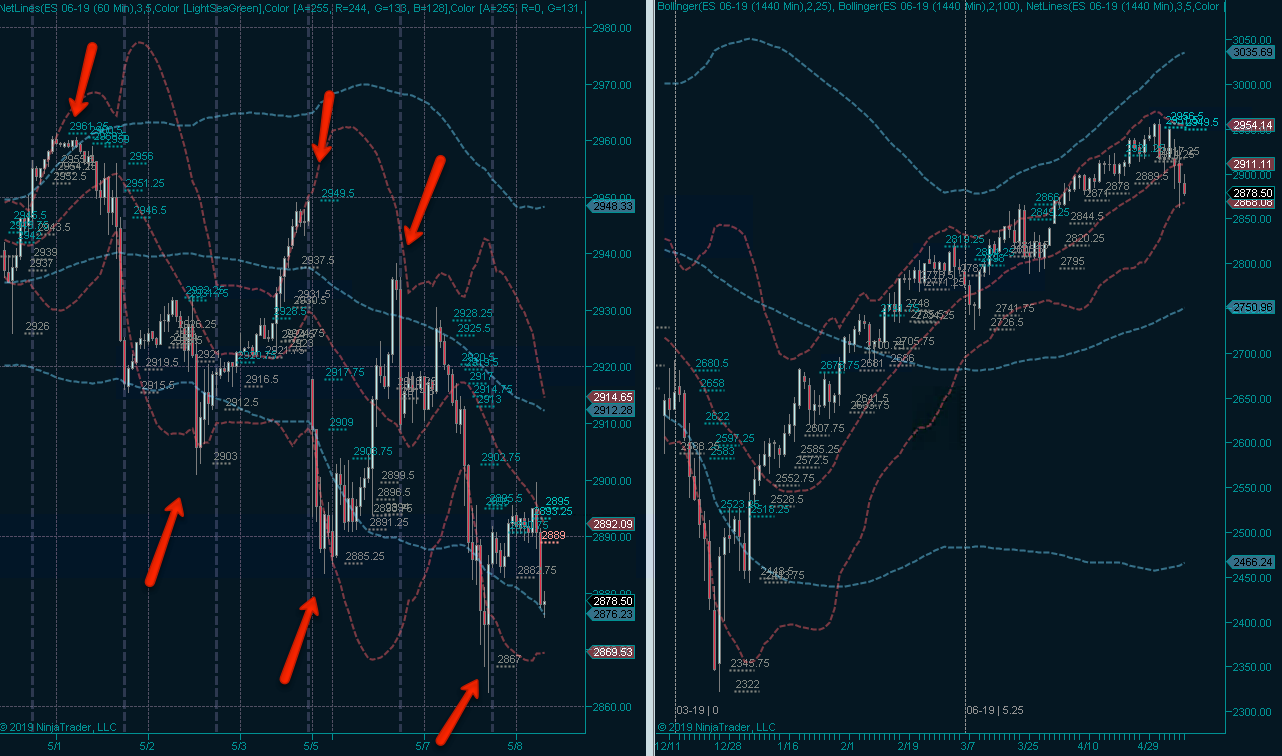
Alright, so now that our perspective has been slightly reset let’s take a look at the recent price action. Yes, bearish – no doubt. And although I’m seeing a promising looking touch of the 25-day SMA I don’t think that we’re all done just yet.
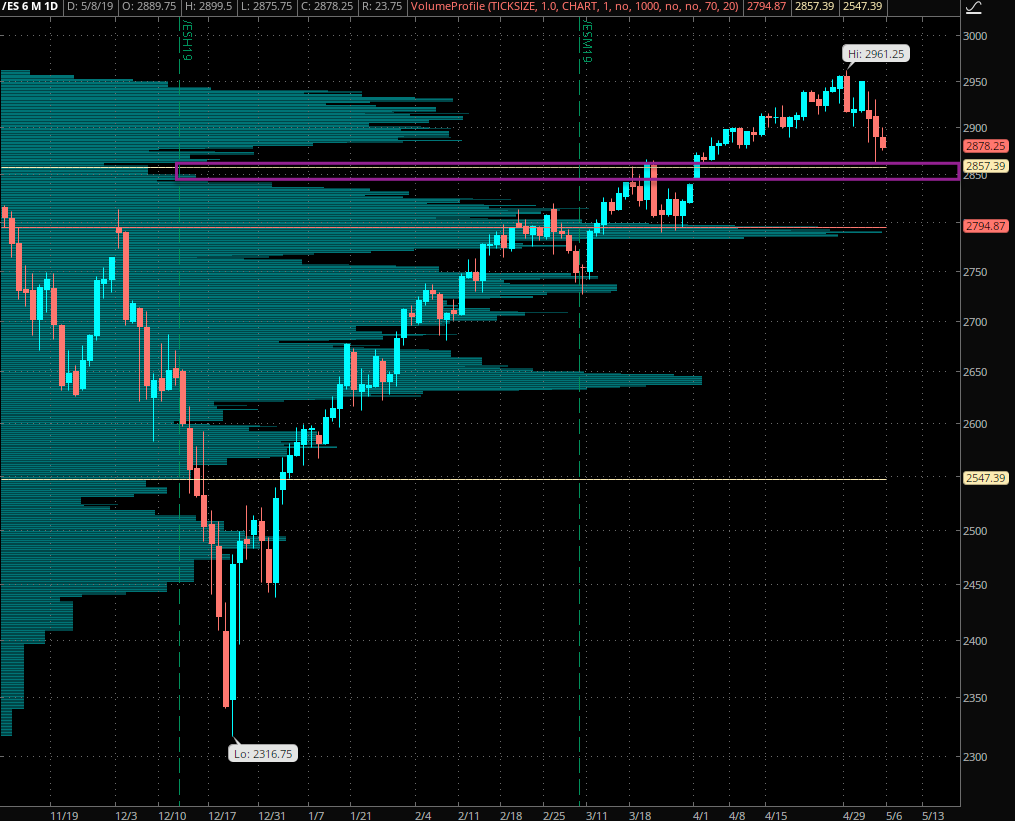
First up we didn’t even fully test the current volume hole that extends between ES 2850 and ES 2880. If we turn right now then I would be highly suspicious. Once again a more bearish session today would be medium term bullish and the inverse.
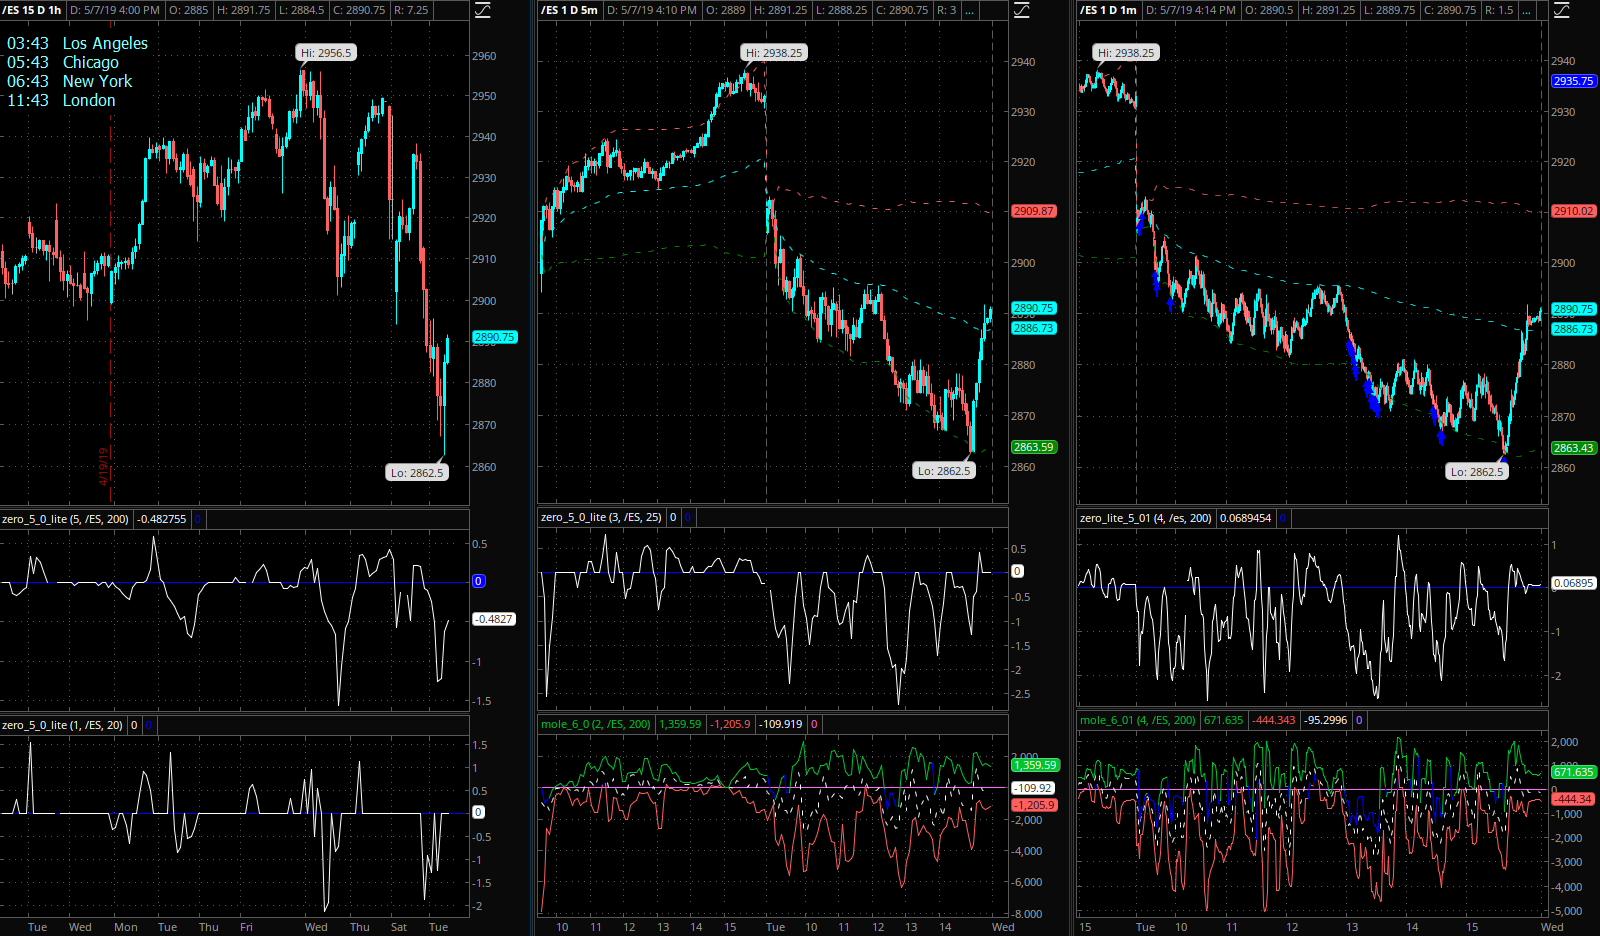
Someone in the comment session mused that the signal on the Zero indicator wasn’t very clear yesterday. Which gave me a bit of a chuckle (no offense) as it couldn’t be any more obvious and I hope most of you subs agree.
Note for example that the signal on all panels barely spent any time in positive territory – quite to the contrary. Plus VWAP was only touched twice and the E-Mini immediately reverted lower. Yes there was a buying spike higher late in the session but it was clearly bot driven and accompanied by a very weak Zero signal.
By the way if you’re not a subscriber then I strongly recommend you sign up here. It’s the price of a single E-Mini handle and basically pays for itself.

The SPX:VIX ratio has been clearly bearish over the past two sessions and I would not want to grab any long positions until that changes. As I mentioned above already, statistically speaking the VIX starts to move along with equities about 56% of the time.
Now guess when that happens? Exactly – near market bottoms or at least when risk sellers perceive IV to have reached an exhaustion point.
Okay quite a bit more below the fold – please grab your decoder ring and meet me in the lair:

It's not too late - learn how to consistently trade without worrying about the news, the clickbait, the daily drama and misinformation. If you are interested in becoming a subscriber then don't waste time and sign up here. The Zero indicator service also offers access to all Gold posts, so you actually get double the bang for your buck.
Please login or subscribe here to see the remainder of this post.


