


Reset Your Market Perspective
Reset Your Market Perspective
Most retail rats launch their trading endeavors (calling it a ‘career’ would be a vast exaggeration) by voluntarily checking themselves into a financial industry indoctrination camp where they are force fed a corrosive diet of nonsense such as magic candle patterns, Elliott Wave theory, moon phases, solar cycles, Bradley Turn Dates, Hindenburg Omens, etc.
The list is long and unfortunately growing on a daily basis. If you ever wondered why there is so much available (mis)information on technical analysis then ask yourself: cui bono?

Fact of the matter is that most of these so called ‘edges’ never have and never will offer anything of a kind, while others may have started to be arbitraged into oblivion back when mullets and ripped jeans were considered the epitome of modern fashion. That’s right, if your chart could get a haircut then the picture above is how it would look like.
Don’t get me wrong, even professional traders stumble upon these superstitions but are quickly forced to abandon them as the trading industry isn’t exactly known to have much tolerance for idiocy or large financial losses. After all at best the next flood of redemption requests is only one quarter away.
Of course there is a better way, but unfortunately it’s rarely taught. Over the next few months Tony and I will be working hard to help you guys ‘turn the corner’ on developing a completely different market perspective. One that incidentally happens to be practiced by institutional traders on a daily basis.
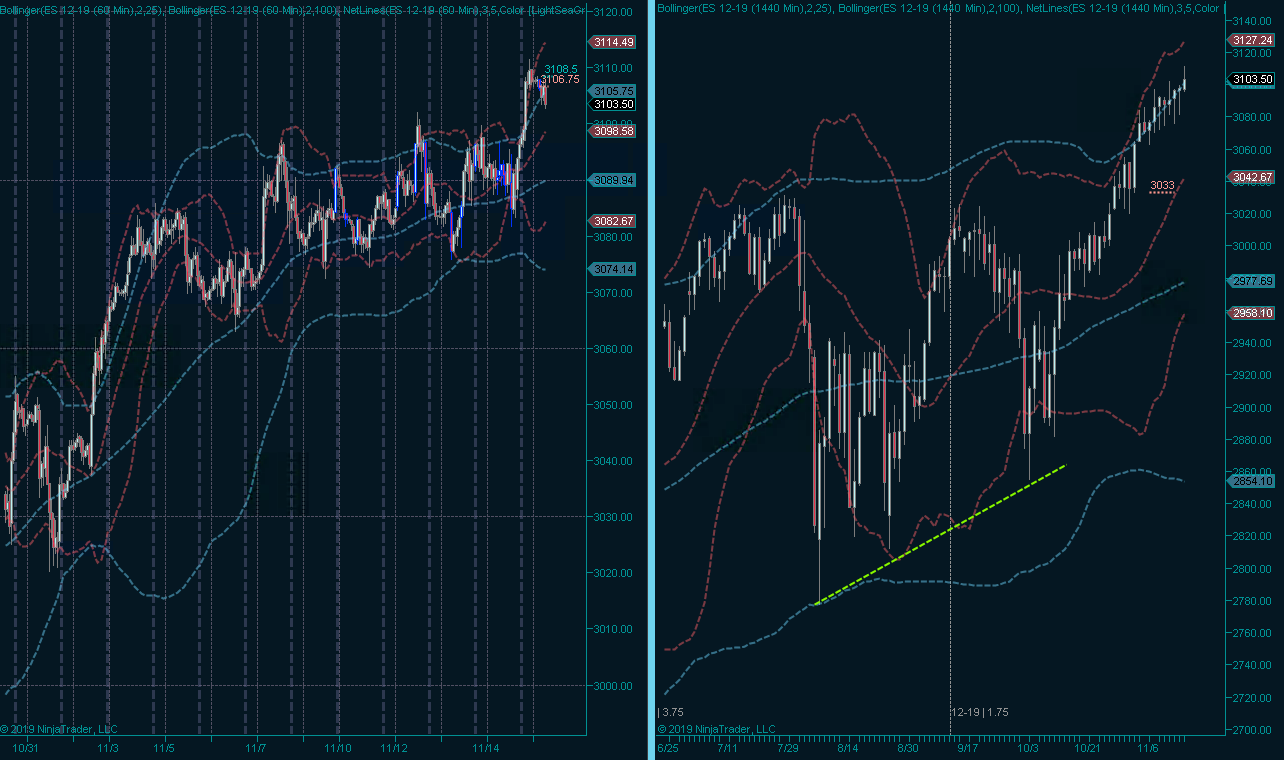
Now by all accounts the past few months have been chock full of whipsaw and sudden twists and turns. Although intra-day volatility has continued to torment us we are however now seeing a gradual reversal to normalcy, if there is such a thing.
If you look at the daily panel on the right then we are recognizing a clear trend leading higher but the ‘barbed wire’ pattern is indicative of continued short term drama.
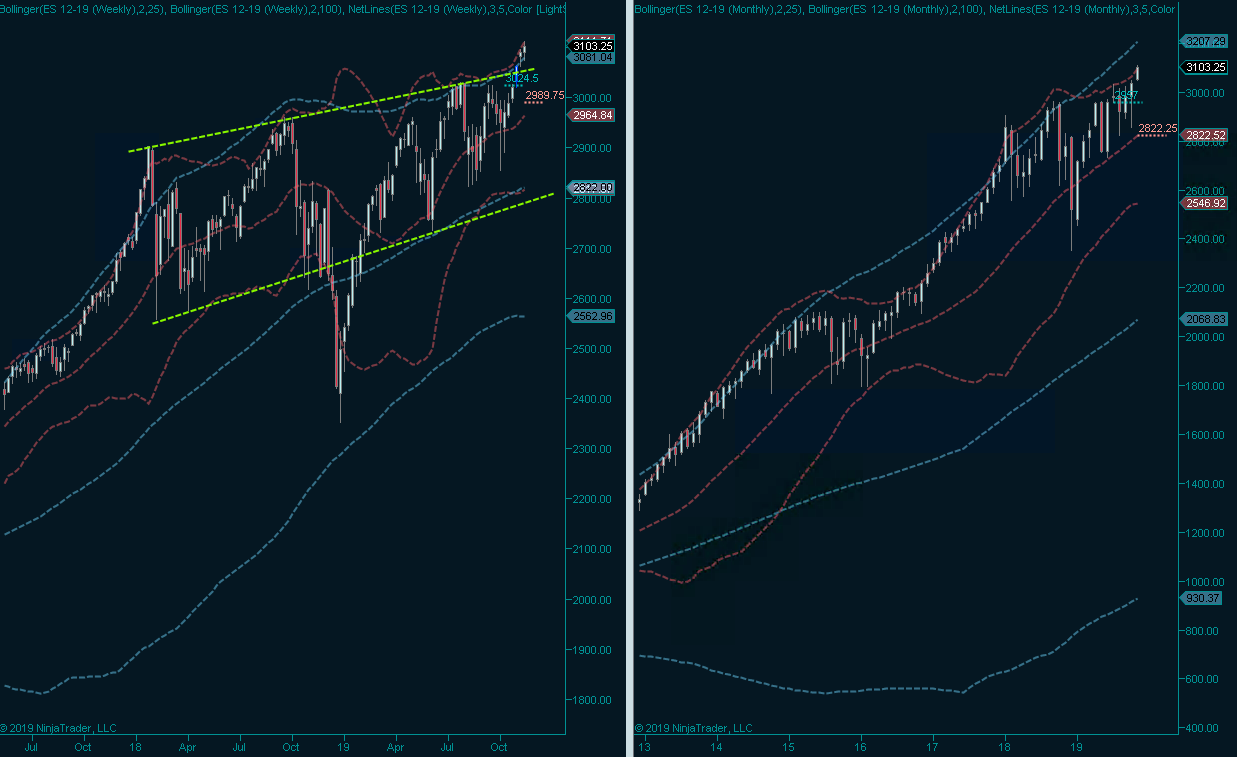
Let’s zoom out a little more for what I call the ‘10,000’ feet perspective, which should strike you as being strange as I actually grew up in Europe. That’s neither here nor there however and I urge you to compare the tape until late 2018 until about late September or early October of his year.
Do you see a difference? I bet you do and although there have been brief periods of low volatility over the past two years they quickly hit the wall after either approaching or breaching new all time highs. The obvious question we should ask ourselves is whether or not we are due for another smack in the face.
Now this and other questions we need to talk about a concept called ‘expected move’, or EM. In case you were wondering, it’s not a chess term, rather EM represents a 1 std-dev expected range for a stock’s price in the future.

Say what???
Okay, so we all (should) know that the range of 1 standard deviation covers about 68% of all expected outcomes. Therefore an instruments’s EM is the magnitude of that stock’s future price movements with ~68% certainty.
Here are the three components that feed into the formula:
- The current price of the instrument.
- Its implied volatility.
- The EM period (expressed in days)
As there are many expiration cycle, we need to use the IV of the options in the expiration cycle closest to our desired time period.
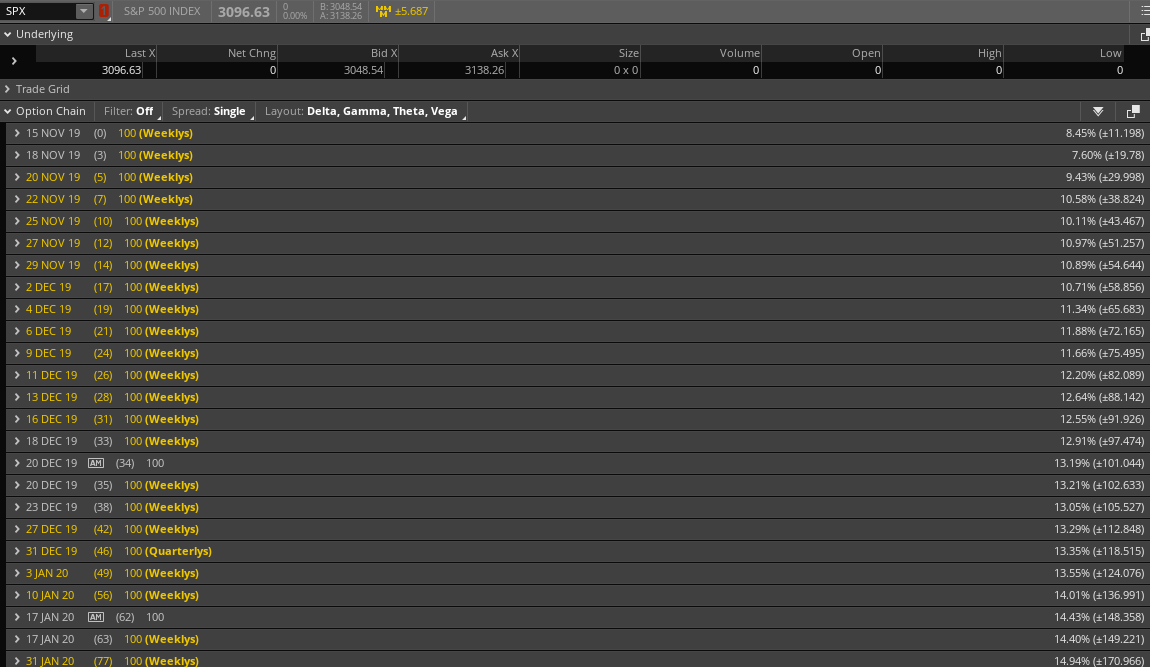
Originally the CBOE only offered weeklys which expired on Friday, then in January of 2016 they added Wednesday expirations, to be followed by Monday expirations in August of 2016.
The CBOE clearly intended to expand its offerings and thus bank more ill-gotten coin in the process, however what they probably didn’t anticipate is that this explosion in option expirations would completely change the market as we know it.
Because what happened almost immediately was a marked jump in what it’s called ‘market efficiency’, which is just a fancy term for saying that asset prices reflect all available information, which incidentally also applies to – you guessed it – expected move (EM).
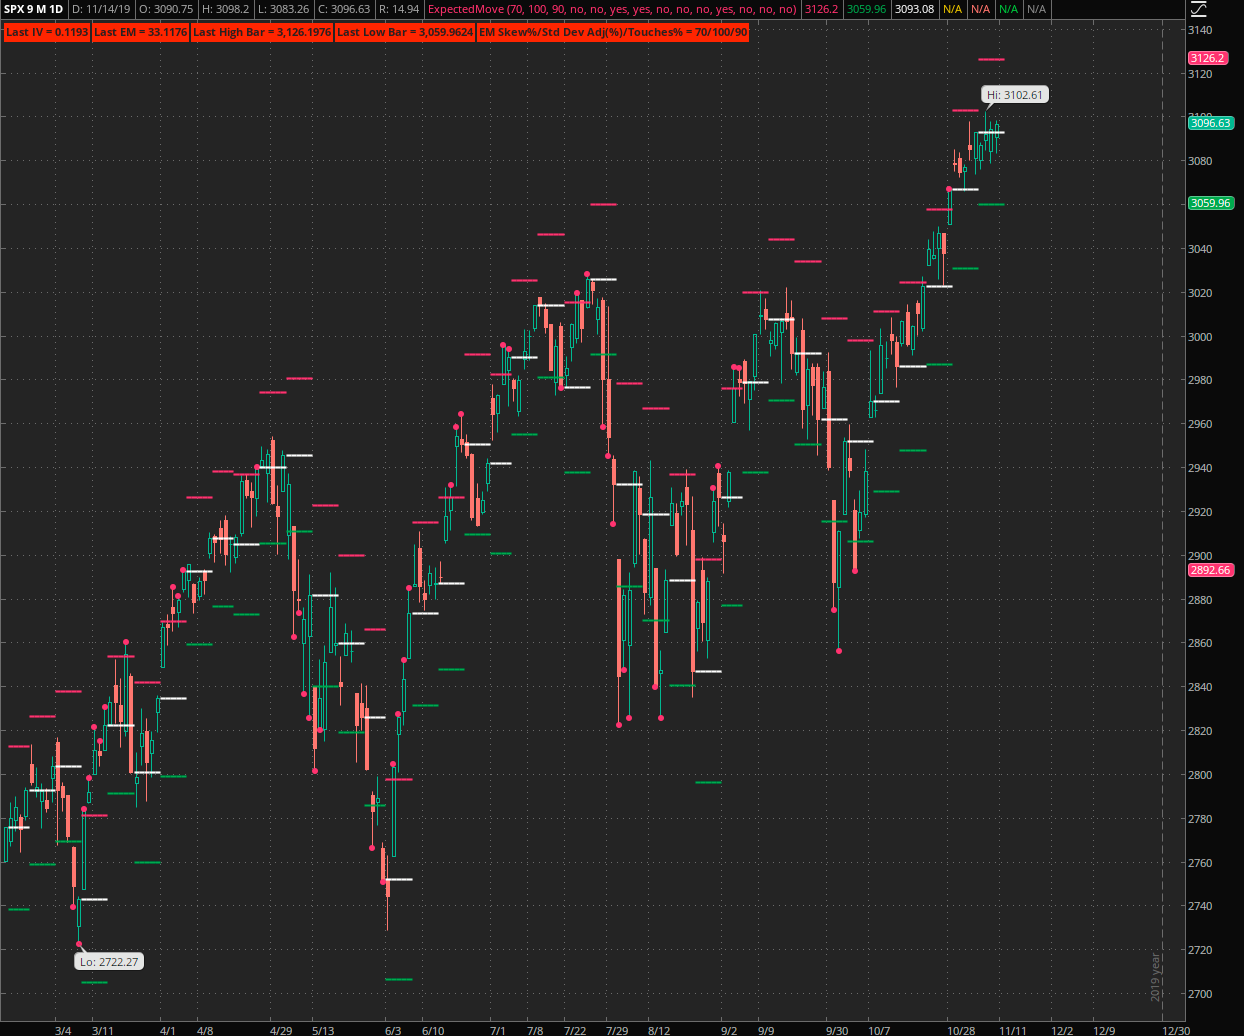
Now this bring us to our SPX chart which is now proudly donning an ‘expected move’ indicator. It’s done in ThinkOrSwim and I plan on porting it to NinjaTrader as well as python over the coming months.
What I need you to do right now is to stop right here and look at this chart for a little bit. First up think about what you are actually looking at. The ranges plotted for each week represent the prior week’s EM as extracted from the CBOE. We are basically mapping the preceding week’s IV against the current week’s RV.
First set of question that come to mind:
Q: How often are option traders wrong?
A Actually the majority of the time IV is pretty damn spot on. Even when price clips the upper/lower boundary it’s pretty damn close. When EM fails in a spectacular fashion then it seems to trigger a series of additional failures as it did starting in June of this year. Put that in the back of your head for now as we’ll come back to this again.
Q: Is there a way to trade EM?
A: Yes, absolutely and much of our future work here will revolve around exploiting what appears to be a clear and reliable edge. Best of which, it doesn’t make use of moon cycles.
Q: Is there a way to trade an expected failure of EM?
A: Yes, absolutely – but it’s more advanced stuff and we’ll get to it in time, grasshopper.
Q: Can EM help me trading earnings?
A: Let me answer it this way:
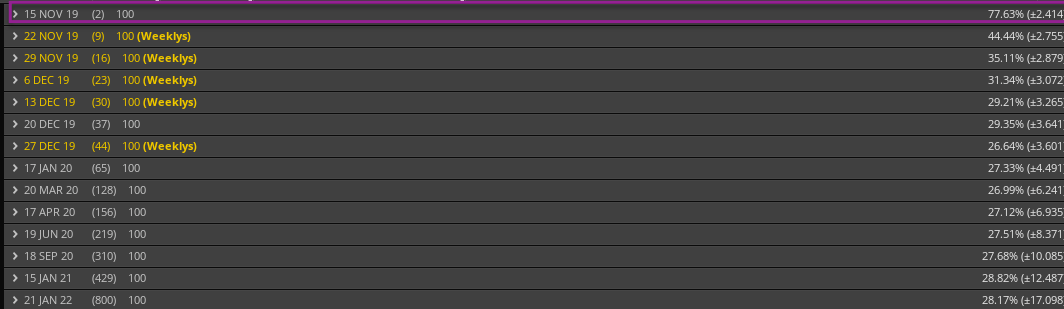
Here are CSCO’s respective EMs on November 13th. Earnings were announced later that evening after the close and the anticipation was move of about 2.4 handles.
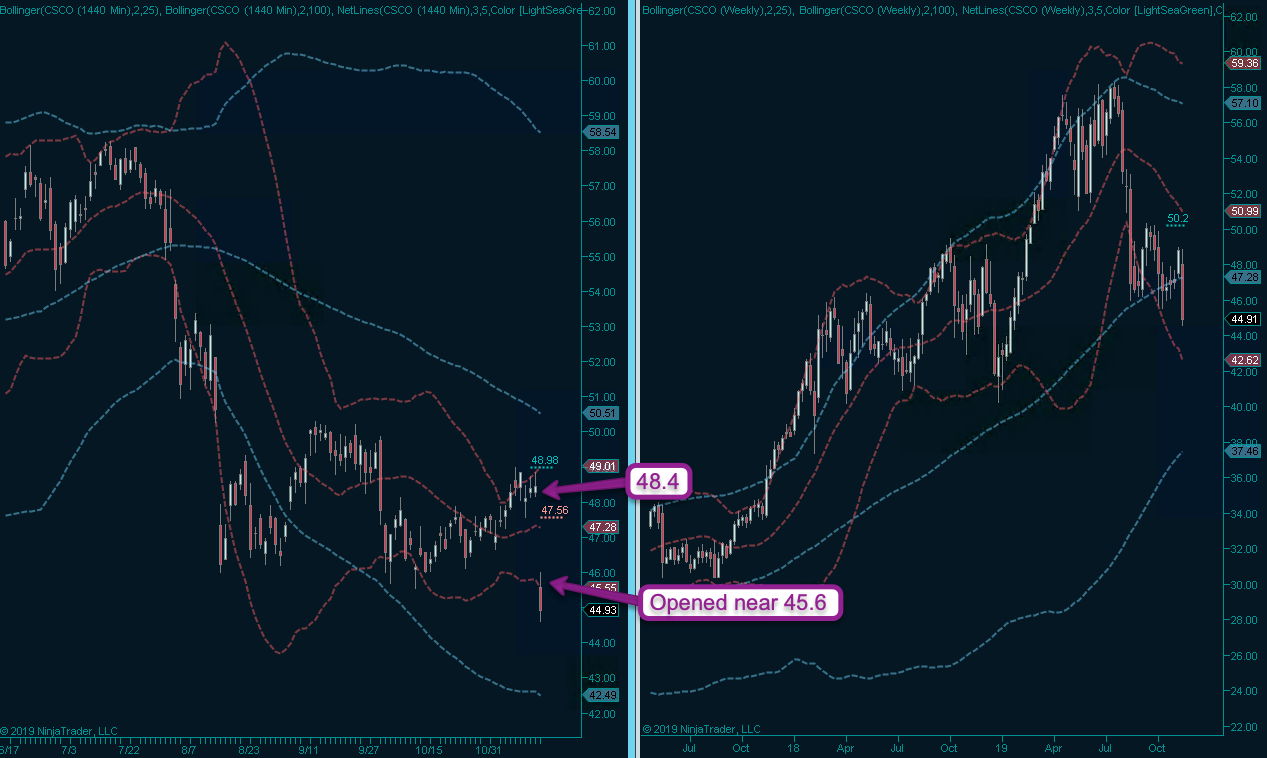
Here’s yesterday’s print on CSCO (the 14th) – it opened about 3 handles lower and then bounced up to about 46, which is spot on. This is not an isolated incident – this stuff happens ALL. THE. TIME. Market efficiency we can stick a damn fork into.
But wait – there is more. Let’s look at AAPL:

It's not too late - learn how to consistently trade without worrying about the news, the clickbait, the daily drama and misinformation. If you are interested in becoming a subscriber then don't waste time and sign up here. The Zero indicator service also offers access to all Gold posts, so you actually get double the bang for your buck.
Please login or subscribe here to see the remainder of this post.


