


Tape Reading Class Is In Session
Tape Reading Class Is In Session
Judging by the E-Mini the SPX will most likely open at new all time highs this morning. I know many of you chronic contrarians are already salivating at the chance of backing up the truck and shorting a market that has shown but little patience for any lingering bearish ambitions. So once again it’s up to me to set you straight with my renowned teutonic touch. Plus we’re going to visit some key markets and use them as a valuable exercise in reading price action.
By the way – all of this and much more is covered in exhausting detail in my Price Action Masterclass – which you can order right here.
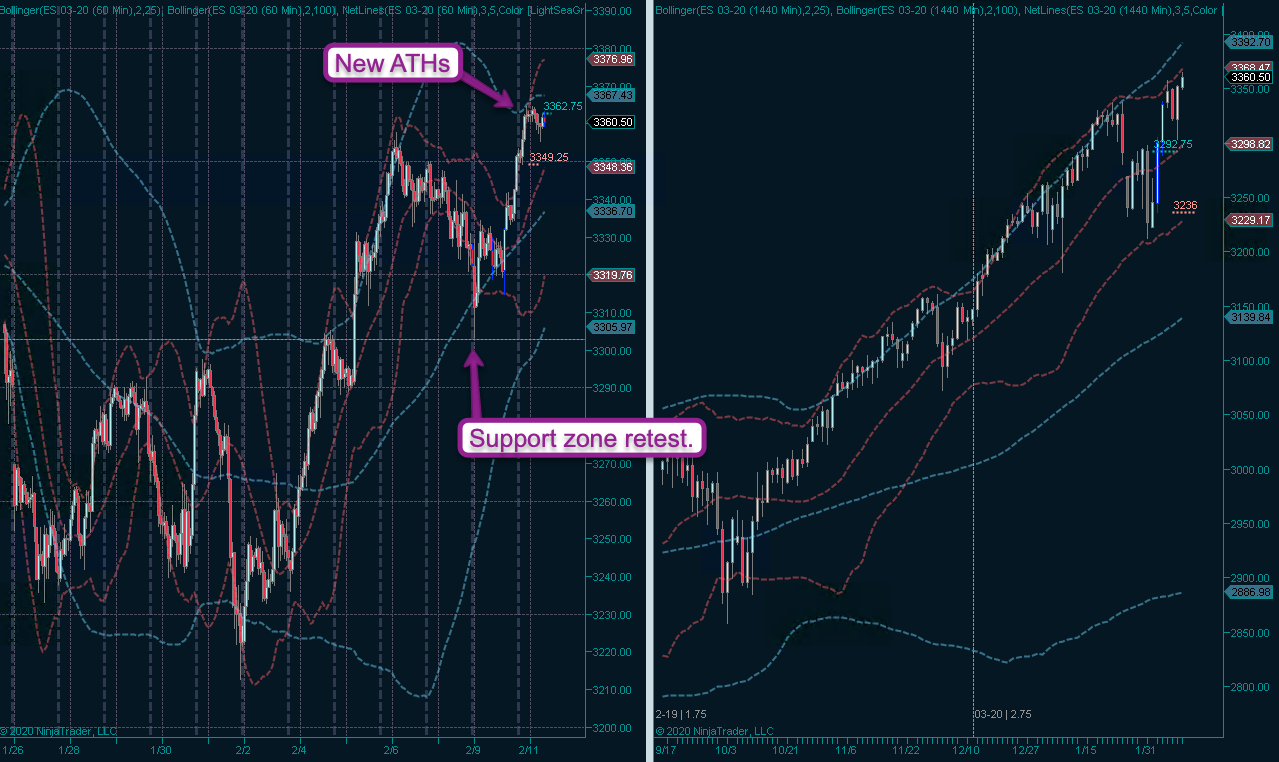
And here it is in all its glory – the E-Mini already over 3360 with plenty of mojo to spare ahead of the open. But the most important aspect of this chart was the retest I pointed out to my intrepid subs yesterday morning.
That quick spike lower was clearly a shake out in the context of a LV run up higher, and as long as ES 3305 remained unchallenged we were most likely destined to finish the week in the plus.
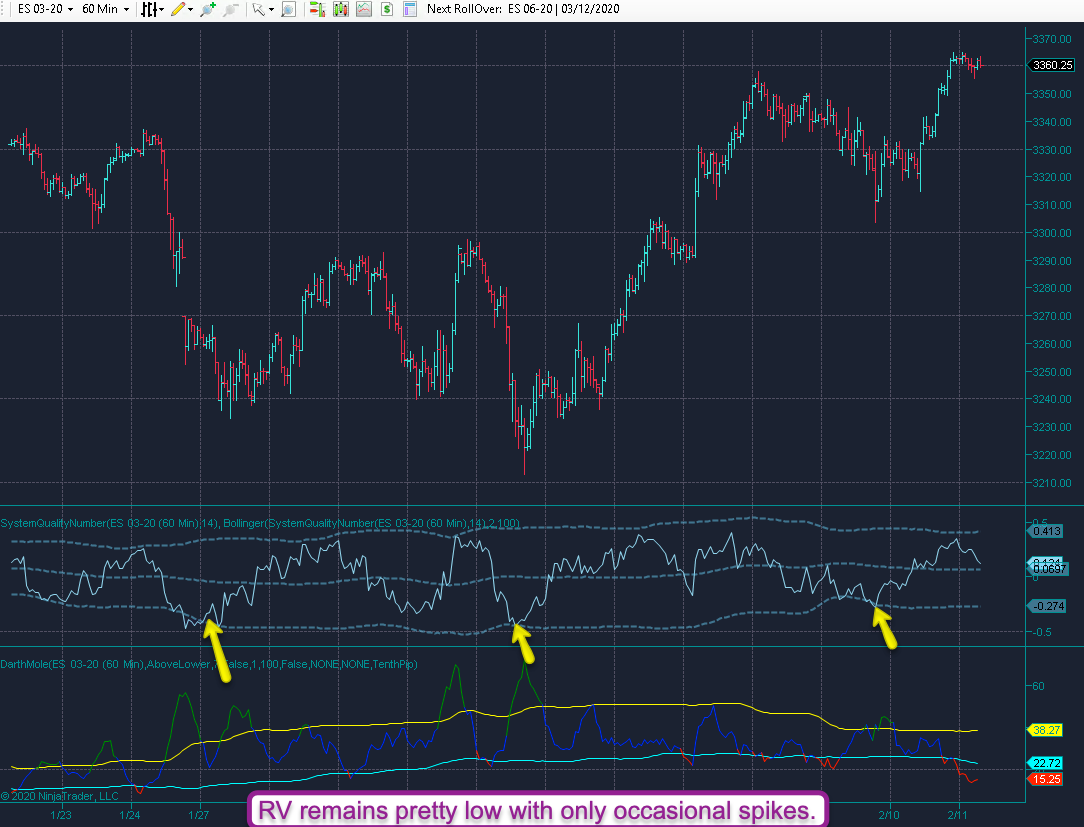
I’m no big fan of indicators and as you know I use them very sparingly. However the SQN panel has been pretty useful recently in recognizing possible buy opportunities. Especially if they coincide with a spike in RV above its 1.0 Bollinger (i.e. the 1 standard deviation threshold).
Here’s a classic edge in a low volatility bull market:
- Wait for sudden drops in an otherwise quiet market.
- Use your favorite floor pattern (e.g. spike low with retest – a.k.a. retest variation) to pick a threshold.
- Enter long at breach of threshold with a stop < the recent (spike) low).
- Profit.
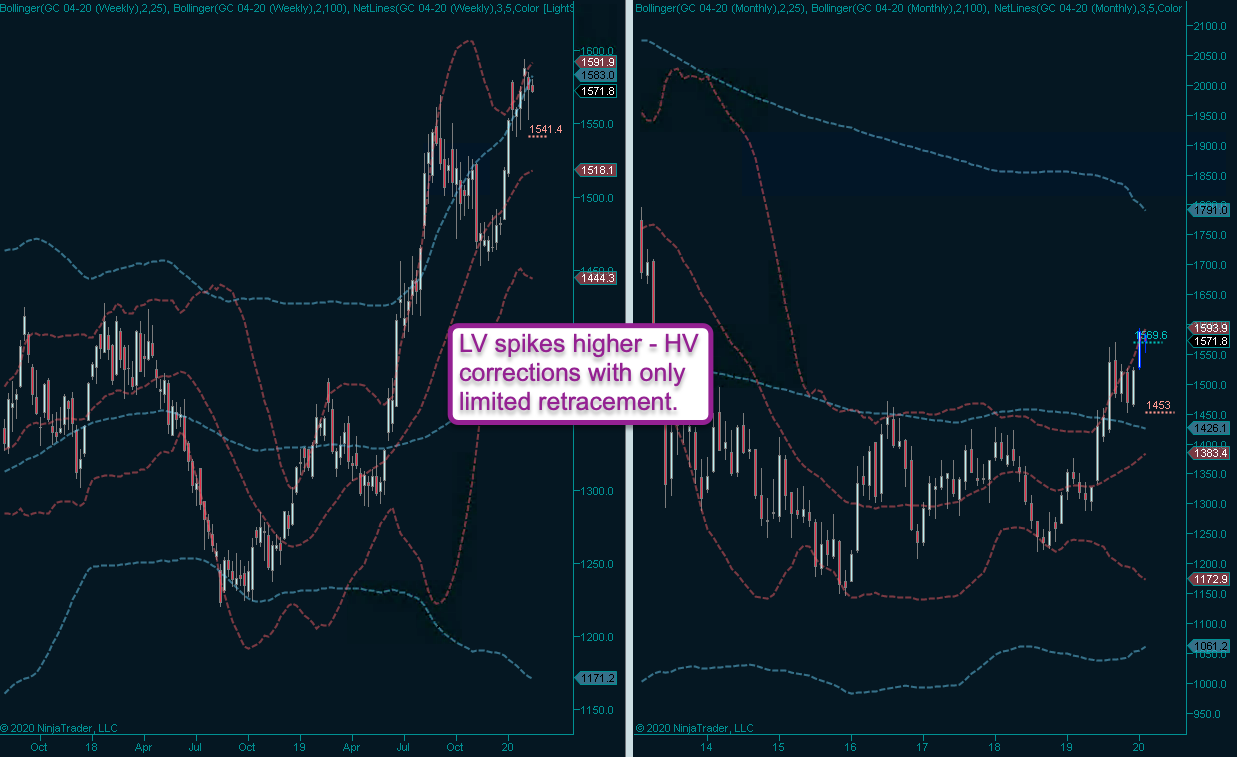
A key observation that goes along with this rather simple edge is that textbook bearish entries continue to fail. Here’s gold which had been stuck in a rut for years on end but most recently decided to pop a box of viagra and proceed to paint the town green.
As you can see there have been several very promising looking bearish opportunities which however devolved into a HV mess and then quickly were reversed in 5 candles flat. What you are looking at on the left is actually a weekly chart (with the monthly on the left), so it’s been quite a ride, ladies and leeches.
There is little to stop gold from reaching the 1800 mark by the end of this year, if not sooner. Which is quite unusual given…

It's not too late - learn how to consistently trade without worrying about the news, the clickbait, the daily drama and misinformation. If you are interested in becoming a subscriber then don't waste time and sign up here. The Zero indicator service also offers access to all Gold posts, so you actually get double the bang for your buck.
Please login or subscribe here to see the remainder of this post.


