


Volatile Systems
Volatile Systems
You guys know I’ve been all over volatility, the realized and the implied kind, for a good part of this decade now. If you curious as to the reasons for my volatile obsession then the most salient one is that volatility is much easier to predict than signed returns. I’ve covered that topic in exhaustive detail over the past few years and today we’re actually going to put it to work.
Okay, I know it’s Monday and I promise to keep it light. Our mission, should we choose to accept it, is to leverage prospective realized volatility exhaustion periods as swing trading opportunities. To that end we’re going to work our way backward starting with early March all the way into today.

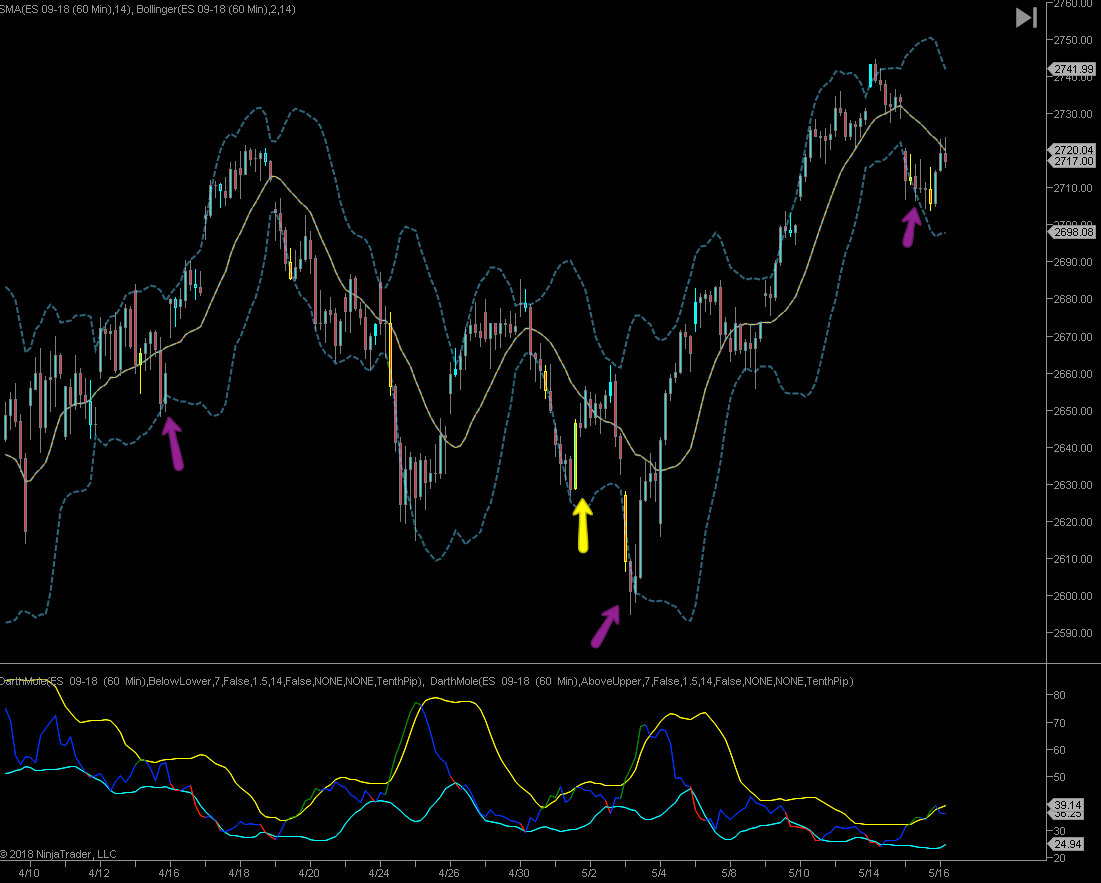
You probably recall the volatility indicator in the bottom panel. The formula of the base signal is rather simple: Calculate the daily ranges by subtracting the candle’s low from the candle’s high. That’s your range signal which you then can smooth via an SMA. From there simply slap a Bollinger on the beast and you’re good to go.
I’ve also added an SMA(14) to the price panel and in the center we of course have an SMA(14). My RV indicator has special logic that colors every candle that causes the indicator to breach > the upper BB and < the lower BB. The yellow candles represent breaches < the upper BB while the cyan candles mark breaches < the lower BB on the RV indicator.
So the first worthwhile observation here is that price and RV Bollinger breaches seem to mostly (but not always) run inverse to each other. Okay, let’s think this through: Does an exhaustion in realized volatility usually coincide with a low in sell off activity?
Many people actually make that assumption and at least on paper they are mistaken. Why? To quote Dr. Ernie Chan:
If [predicting realized volatility echoed] the accuracy for predicting the sign of the SPY return itself, we should prepare to retire in luxury. Volatility is easier to predict than signed returns, as every finance student has also been taught. But what good is a good volatility prediction? Would that be useful to options traders, who can trade implied volatilities instead of directional returns? The answer is yes: realized volatility prediction is useful for implied volatility prediction, but not in the way you would expect.
If GARCH tells us that the realized volatility will increase tomorrow, most of us would instinctively go out and buy ourselves some options (i.e. implied volatility). In the case of SPY, we would probably go buy some VXX. But that would be a terrible mistake. Remember that the volatility we predicted is an unsigned return: a prediction of increased volatility may mean a very bullish day tomorrow. A high positive return in SPY is usually accompanied by a steep drop in VXX. In other words, an increase in realized volatility is usually accompanied by a decrease in implied volatility in this case.
Okay, so the ability to predict realized volatility, on its own, does not offer us an exploitable edge in the market. And I’m not just parroting the opinions of the good Dr. Chan – I myself have spent years correlating price action with RV and thus far only saw limited benefit.
Of course that does not mean we shouldn’t attempt to throw in other alpha factors into the mix. Which obviously I am attempting to do here. If you again take a look at the chart above then you see magenta and yellow arrows. The magenta ones point toward times when see RV exhaustion (yellow candle on the price chart) followed by price breaching below and then recovering above the lower Bollinger. The yellow ones point to instances when there RV exhaustion follows a breach through and back above the lower BB on the price panel.
Well at least on this panel I see four winners and two losers. Not bad – let’s keep looking:
Here we’re looking at April and May. God how much I miss spring but fall is beckoning and is almost as good. Now here I see four winners – three and a half if you don’t count the first one. One rule I forgot to mention is that the yellow candle needs to flag < the SMA(14) – and it’s the opposite for the cyan candles (which we’re not covering today0.
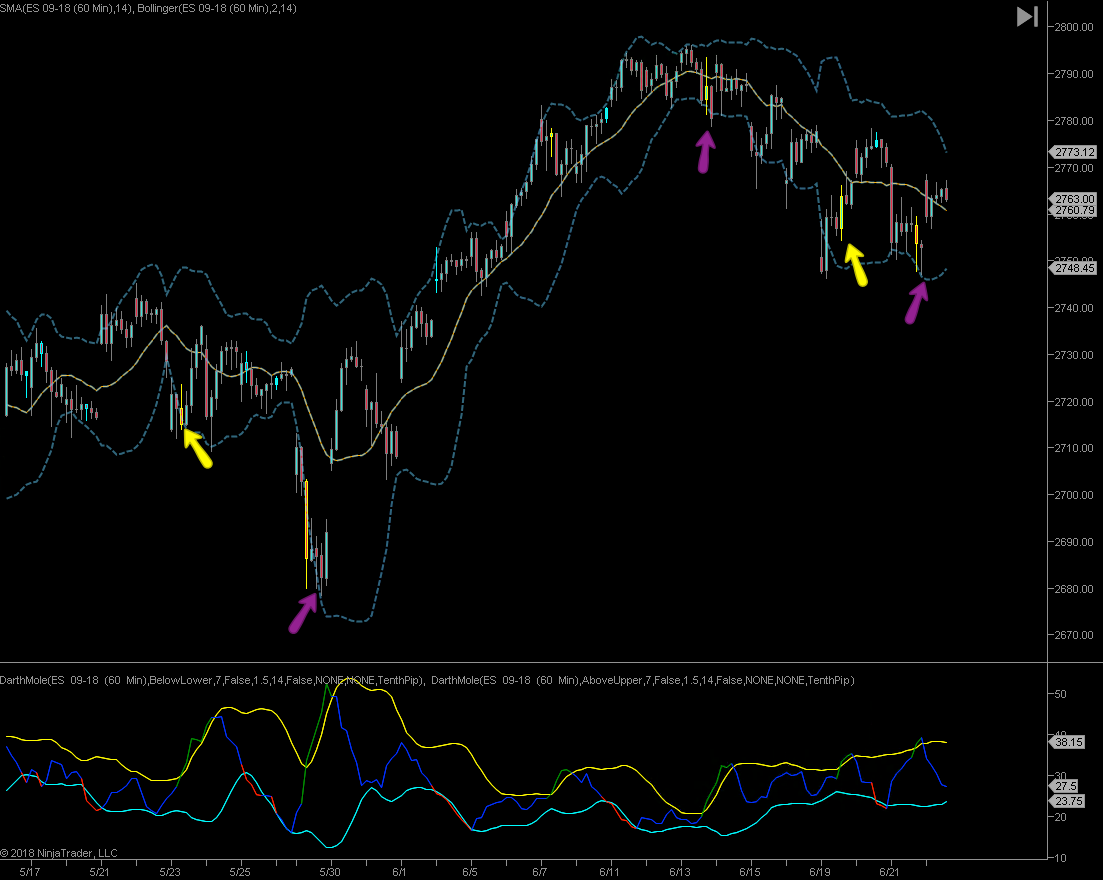
May and June offer us three or four winners, depending on how soon you advance your stop to break/even.
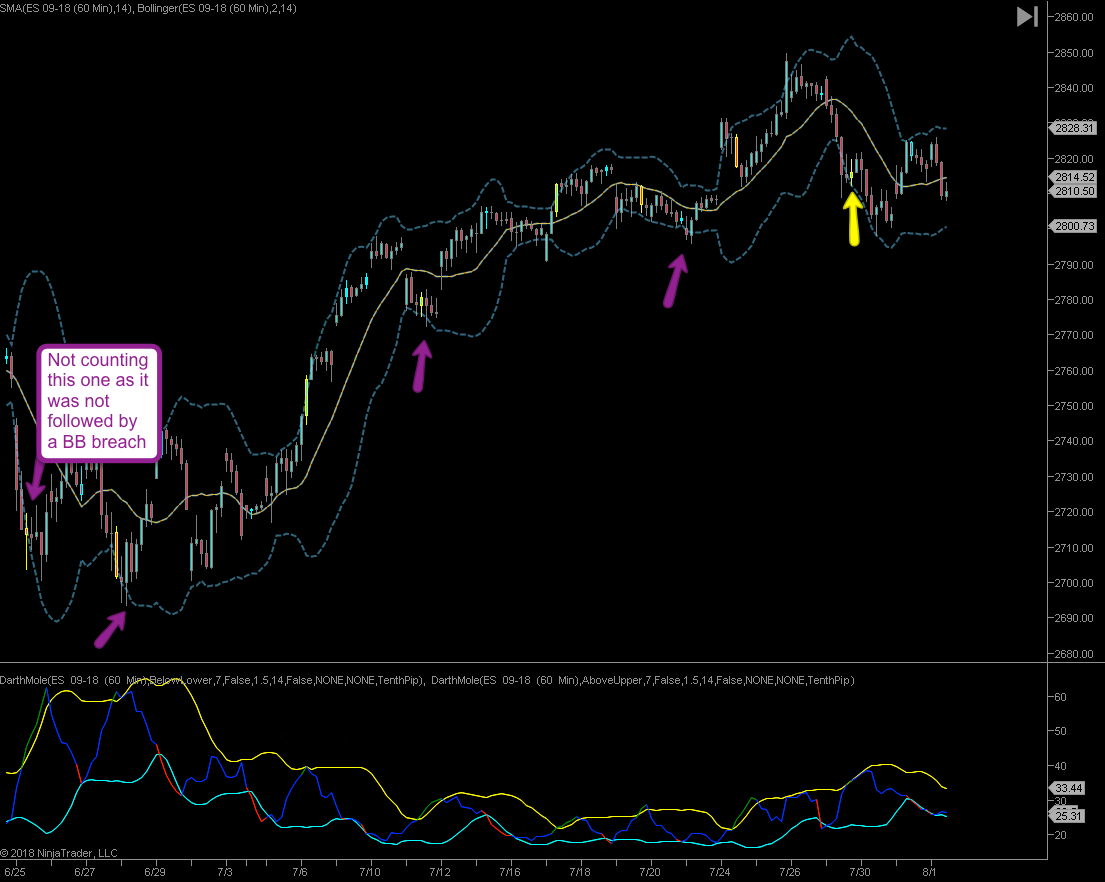
Here we are in June and July. Three winners and that last one is clearly a loser. FYI I didn’t count the very first one as I don’t count RV exhaustions which are not followed by Bollinger breaches. The idea here is that I want to see RV roll over and slow down while price is producing some kind of sign that it’s ready to revert.
In this particular system we employ simple spike lows that managed to pop below the lower Bollinger. But you could use any number of alpha factors. Be creative!
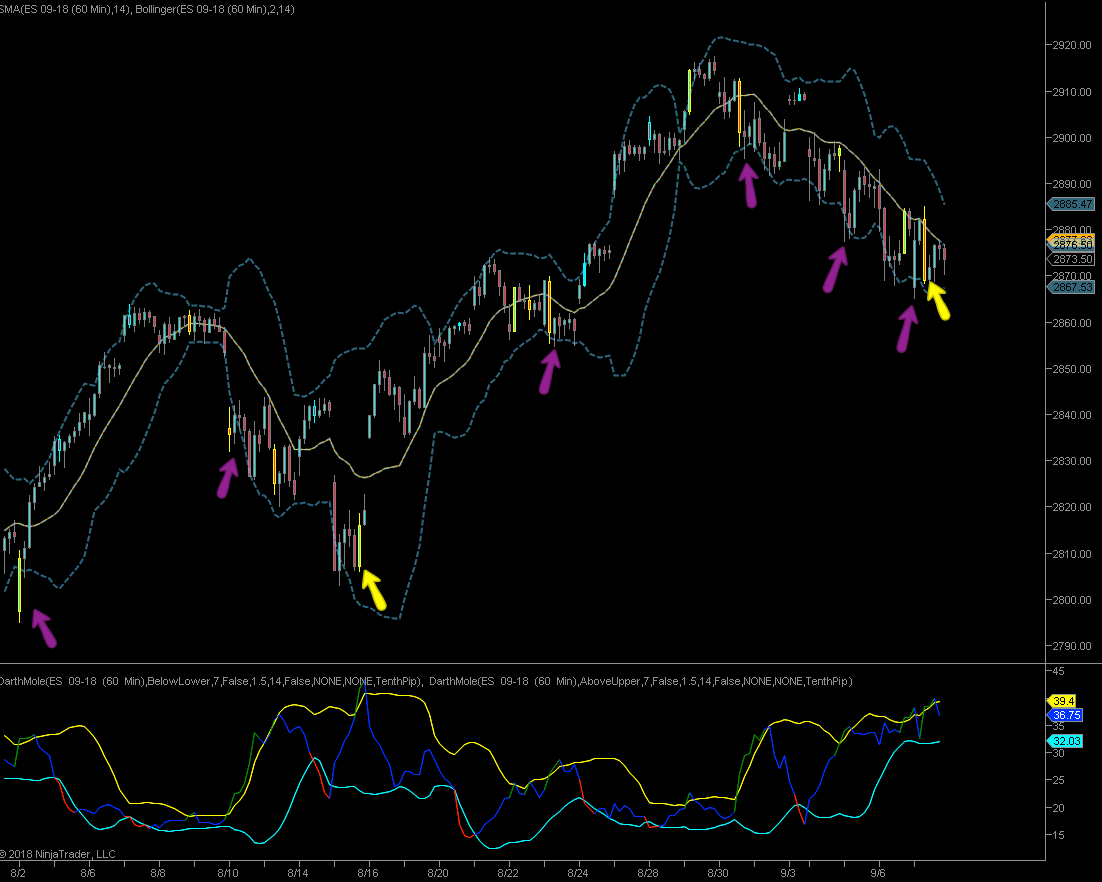
Which brings us to the very last example terminating today. Things are looking good at first – I see three winners and two losers. Not sure if I really should count the one with the yellow candle near the SMA – I usually prefer those to be placed further away from the rolling mean.
And that finally brings us to the current formation which is a bit of a furball. First up RV exhaustion signals keep getting triggered here due to the compressed BB range on the RV indicator. Which is not something we see very often apparently. The very first chart from March shows us one occasion but that BB compression is near the floor, not near the top of the RV range. So what does that mean?
Could RV remain elevated or even expand further? Yes, absolutely. If we saw more whipsaw and intra-day volatility then this could go on for a while, producing several more RV exhaustion signals. Kind of when a stochastic or MACD becomes embedded in the upper range > 80% or so.
But what are the odds of that? Well, we have the technology – please step into my lair:

It's not too late - learn how to consistently trade without worrying about the news, the clickbait, the daily drama and misinformation. If you are interested in becoming a subscriber then don't waste time and sign up here. The Zero indicator service also offers access to all Gold posts, so you actually get double the bang for your buck.
Please login or subscribe here to see the remainder of this post.


