


No Surprise Earnings
No Surprise Earnings

Fujisan here.
As the market has been going through a range bound for the past many weeks, and people are so frustrated with the market’s indecisiveness, I thought that at least I should be able to help you guys out on the earnings play. So I looked at several stocks for the next week’s earnings, and I was very disappointed, to say the least. IV skews between the front and back month options of the underlying stocks are pretty much flat and no major market move is expected one way or the other upon the earnings release this time around.
ATM Calendar Play
My earnings option strategy is ATM calendar with delta neutral position. This position is placed in order to capture IV crush after the earnings release. Please take a look at my previous post if you are not familiar with IV crush and ATM calendar strategy. What happens before earnings is that MM (Market Makers) pumps up the pricing of the front month option premiums and drop it right after the earnings and this particular price action (pump and drop) is called IV crush.
Last Quarter’s Earnings Play Results
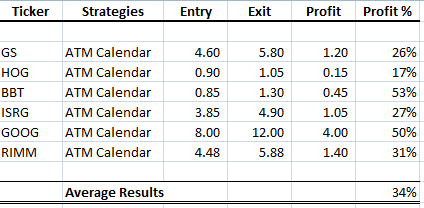
In order to take ATM calendar strategy, IV skew (the % difference between front and back month IV) has to be at least 20. Here is a result of the previous ATM calendar earnings play. Please note that the success of the results is mainly due to a huge IV skew (pump and drop) price action and those IV skews were as wide as 100 in the previous quarter.
No Surprise Earnings
When I look at the stocks like GS, GOOG, BAC, JPM for this time around, there are hardly any IV skews in any of my favorite stocks. No IV skew means no pops, no drops – no surprises. The market expects pretty much flat reactions from the earnings and here is a summary of the major earnings coming up next week.

As you can see, most of the above stocks’ IV skews are in a range of 20~30, which is really a minimum requirement to take ATM calendar strategy, but not really attractive compared with the previous earnings IV skew where the front month IVs were pumped up as high as 150% to sometimes 200%.
Of course we still have 5 more days to go and this could still change dramatically – but generally speaking, last quarter’s IV skews were much wider even one week before earnings.
The results of the current IV skew really confirmed my assumption of the current market’s status quo prior to OPX.
GOOG ATM Calendar
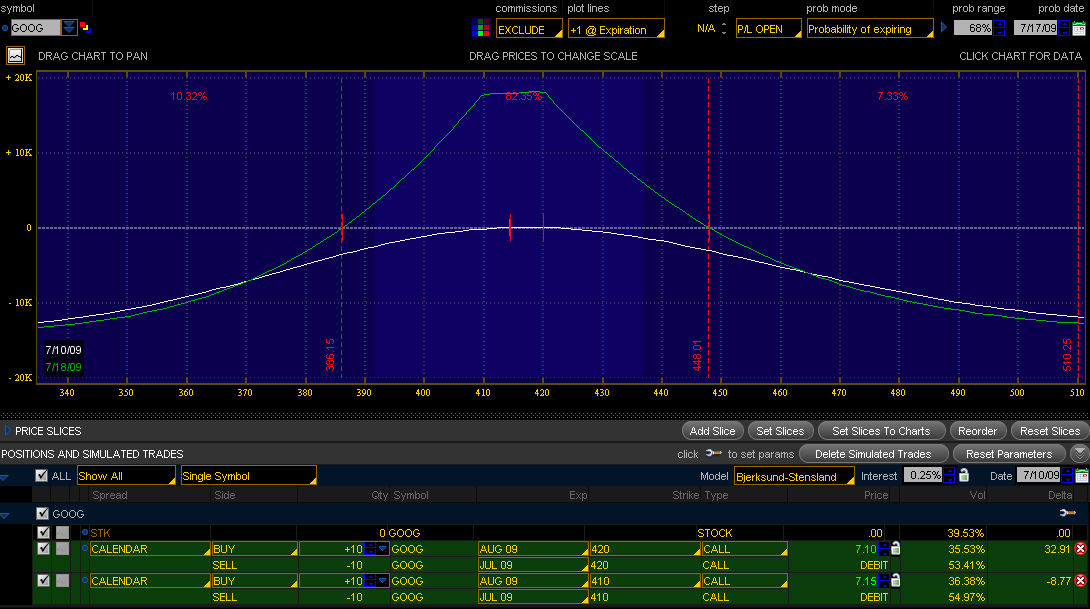
Now, if you still like to try out ATM calendar on one of these stocks, here is an example of GOOG double calendar (of course!). With GOOG’s closing price of 414 on Friday, this is 410/420 July/Aug double calendar spread, and the probabilities of GOOG landing somewhere between 490 and 450 before OPX would be more than 80%. Although the return may not be as good as previous earnings, the probabilities of success seems to be much higher.
Please note, the key to this strategy is to put the calendar right at the price of the underlying stock before earnings so that the probabilities are working for you.
JULY OPX Play
I have been saying this for a while, but if 880 neckline is not taken out (and so far, this has been holding), then my July OPX target remains around 900.
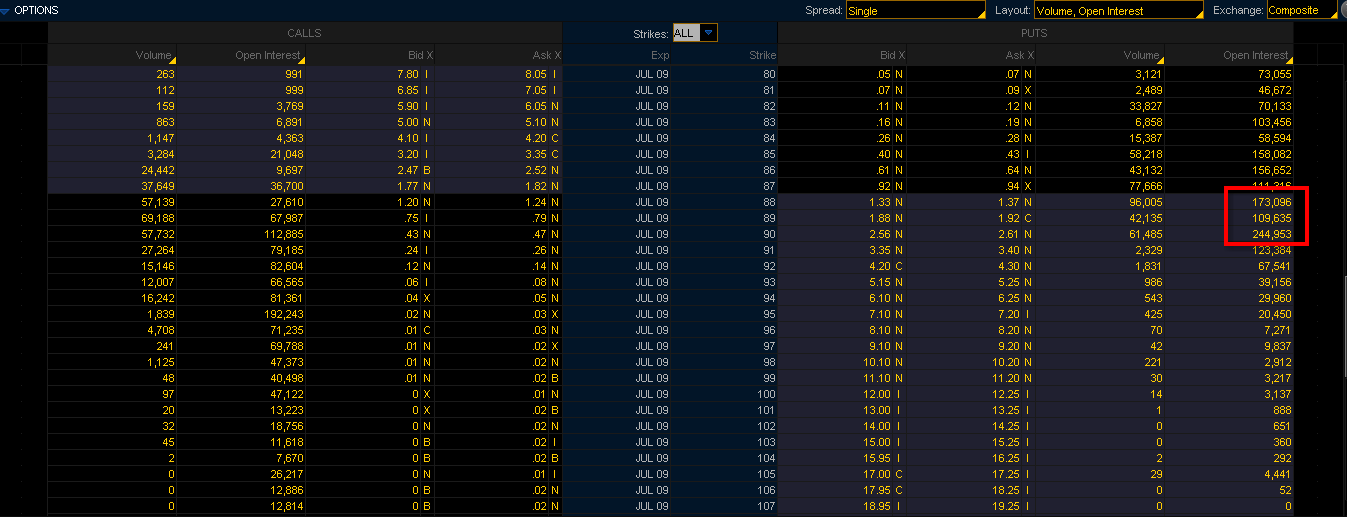
I know that open interests are deceiving sometimes, but I have been right on for picking up OPX prices for the past several months and here is July’s SPY Open interests. As you can see, 88 and 90 have the most open interest at this point and that’s where I’m looking at for OPX. I have put on 85/90/95 butterfly and 86/88/92/94 iron condor last week. When the market is going through a range bound, this type of position trading works out quite nicely instead of trying to pick the market direction. Let’s see how this plays out.
Forex Trades
As I was getting bored with my equities trades, I have been so much more involved with forex trades these days and have been quite successful in picking up a big currency movement.
I have discussed my forex trade setup last week, and what seems to be working quite well is to take the other side of the trade when I was being stopped out.
Here is an example of my GBP/JPY trade last week. I was placing an order to go long right against S1 pivot point around midnight PST. When I woke up in the morning, I realized that it was forming a bear flag, so I placed a short order at a break of S1 pivot point.
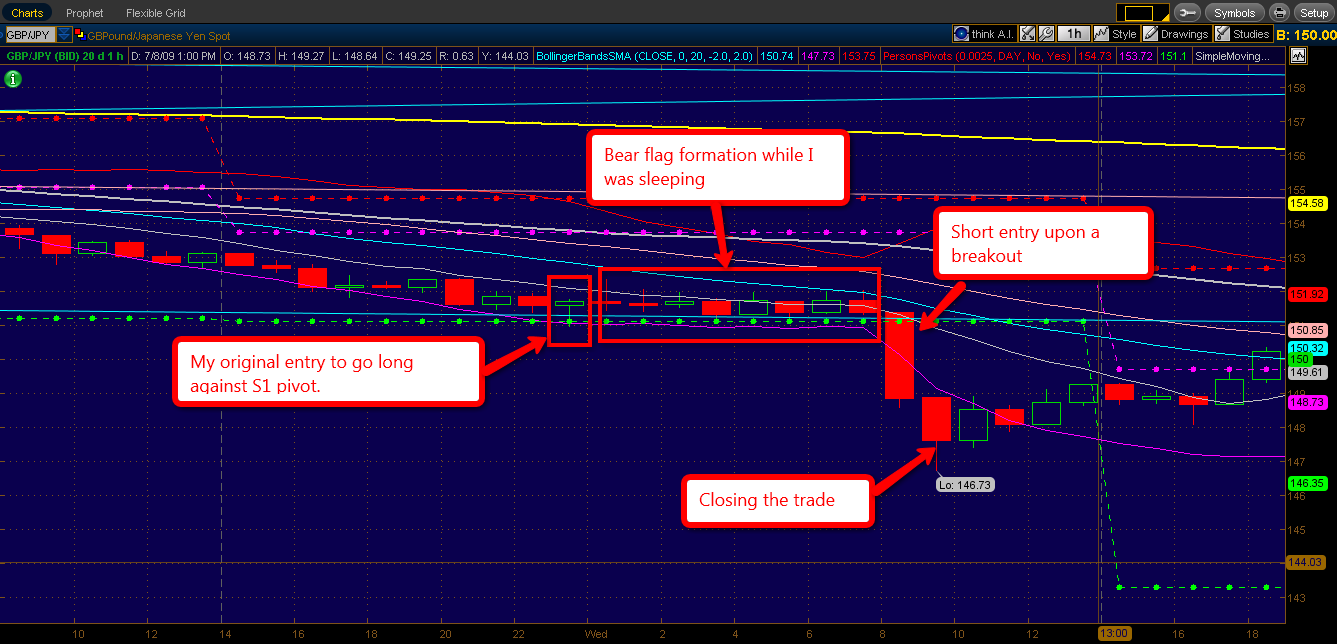
The danger of this type of trade is that, if this was a fake breakout, you can be stopped out in both directions, but the beauty of trading pivots is that your entry points are normally set up against daily support /resistence level, therefore, the break of that particular point could result in a much bigger winning trade. Luckily, this turned out to be a winner, whopping 500 pips in a matter of 2 hours. Wonderful trade.
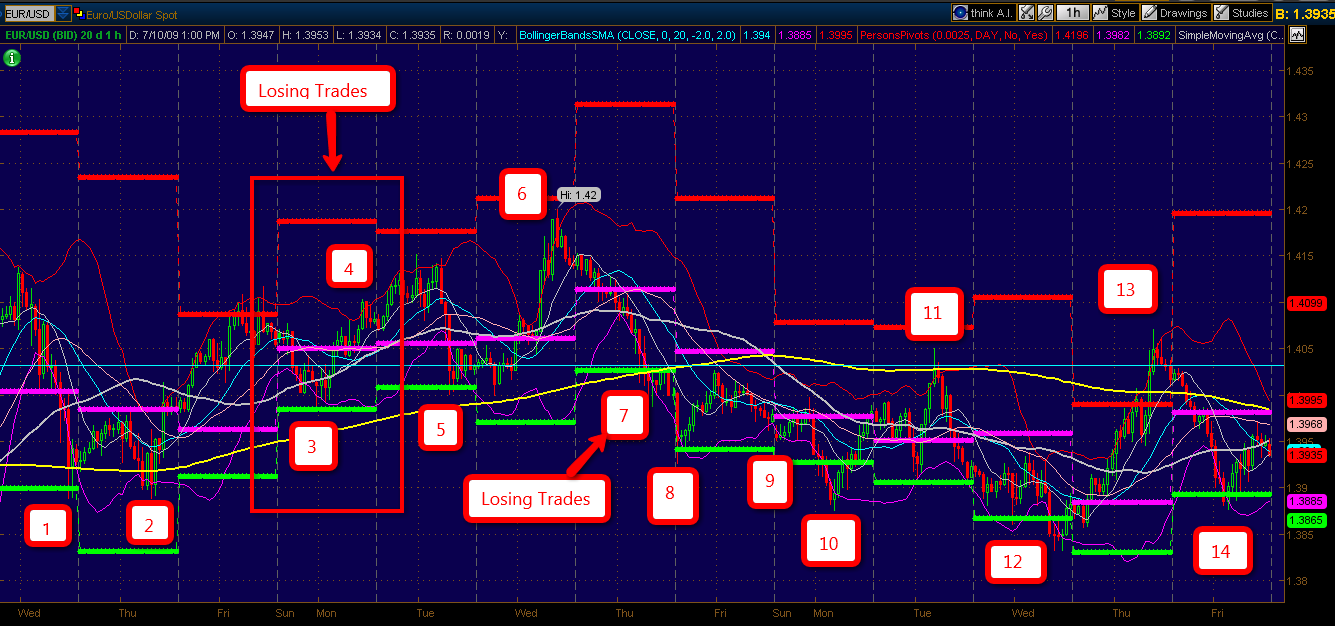
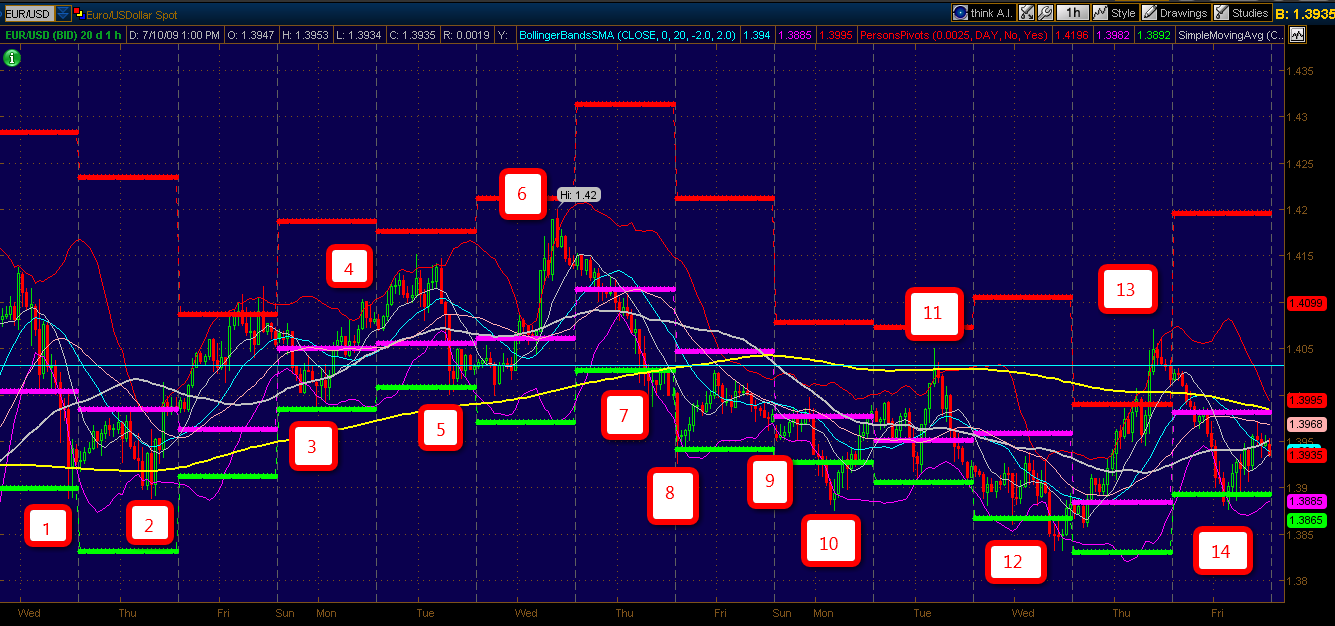
Mole’s BB trade set up
OK, I screw up Mole by talking him out of going short EUR/USD on Thursday, which resulted in a much bigger missed opportunity of 200 pip move (sorry, Mole!). As EUR/USD was not my regular trading vehicle, and I did not pay much attention to this before, but when I look at EUR/USD by using Mole’s BB trade set up, I can spot a trading opportunity almost on a daily basis. In fact, there are 14 trading opportunities out of 13 trading days, of which only 3 trades would have been a losing trade and this could be mostly avoided by adding extra entry rule. This BB set up works out perfectly for a highly volatile pair like EUR/USD. Please note that this set up may not work for a trending pair. Here is a suggested trading setup:
Entry Setup:
1. Find a candle closed outside of BB.
2. Wait until the candle is closed inside of BB.
3. Enter upon the close of the candle 2 above or open of the next candle.
4. Set up a stop underneath of the candle 1 or 2, whichever is higher/lower.
5. If the candle 2 is larger than the candle 1, do not initiate the trade.
Target Setup:
1. Take half off at the next pivot points (most likely PP point).
2. Take the remainder off at the following pivot points (S1 or R1).
Stop Setup:
Have 3 different stops ready. For this reason, I place orders in 3 multiples.
1. Leave the original stop (and move it to the breakeven point once the trade started taking off) until the pair reaches PP. Once it hits PP, move the stops below PP.
2. Trailing stop
3. Manual (i.e., move the stops below the previous candle)
If any of you could come up with a better set up, please let me know. There is always a room for improvements and I’m open for suggestions.
Longest Solar Eclipse in the 21st Century
GBP/JPY price action occurred on July 8th, right after Lunar eclipse. I have noticed that Forex price actions are significantly influenced by the astro cycle, and their price movements go totally wild on those days. I’m looking forward to the next cycle day, July 22, and this is supposed to be the longest solar eclipse in the 21st century.
Have a good weekend, everyone.
Fujisan


