


Burning The Temple
Burning The Temple
Hello denizens of Evil Speculator! Just as Mole is off to visit his indigenous peoples of Austria, I’m back from a week of honoring my Fucks Given Reduction (FGR) process in the California desert at Lightning In A Bottle (LIB). Fresh and ready to go deep into some stuff you can actually use to trade with. As a bonus to my Cali trip, I got to spend a time in Venice with a man who goes by the moniker The Trip Advisor, who is behind-the-scene responsible for the biggest hit Post Malone has.
His morning affirmation routine is simply like nothing I’ve ever seen and deeply inspired me to completely change mine up. On to talking shop about trading…
As traders, over time we tend to gravitate towards certain markets and certain types of trading. Some of us might be day traders or swing traders. Some momentum traders, others mean reversion. Some are forex scalpers. Others are trend following futures traders. And then there are options traders which can fit into many different pigeon holes.
Over time I’ve learned my chops and mastered the nuances of my particular area of expertise, intraday stock trading. It’s hard to be a master of many markets when there are so many specific pieces for each particular market that are necessary to understand in order to have a long term edge.
As Van Tharp says, we don’t trade the markets, we trade our beliefs about the markets. And these beliefs can really leave us stuck in the mud, unaware that our problem is our beliefs, not the markets.
For a long time, I didn’t understand the options traders who looked at option chains all day and we’re crunching numbers. I thought to myself, “they just don’t get it – automated day trading stocks is WAY better!” Duh!
Likewise, they think the same thing about automated algo traders – we spend hours writing, testing, debugging APIs, etc. In the end, it’s two different paths that lead to the same place. I realized I needed to put aside my beliefs and address the hard facts: these are guys putting triple digit returns on the board year after year. Slowly, I became interested in what they were doing and expanded my horizons.
I realized it could really improve my day trading of stocks and understanding of how all markets work and affect each other on a deep level. Since most of my trading is already centered around volatility trading and this is my growing area of expertise, I started feeling like an idiot for not incorporating options into my trading arsenal years sooner.
It was time for me to burn the temple – torch my sacred views of the best way to trade and expand my reality with options. So today I want to give a brief demo of how bridging these two worlds can work and dramatically improve the trading of both in the ADD inducing world of short term trading.
Hacking The Expected Move
If you’re familiar with options and the greeks, it can be overwhelming for new options traders. Delta, gamma, theta, vega. It’s a lot to wrap your head around for new traders, especially if your math chops aren’t on fleek. However I think of these much differently. For the type of trading Mole and I do, the most important piece of all these things is what’s known as the expected move.

Here is a screenshot from the Think or Swim (TOS) platform and we can see as of Tuesday morning pre-market, the expected move between now and Friday’s close is +/- 5.796.
In most platforms these days, it gives you the expected move and implied volatility of the underlying. Another way to get the ball park expected move is to take the at-the-money (ATM) call and put price and add them together.
What is the expected move? It’s simply the expected move of the stock between now and the expiration of the option with +/- 1 standard deviation (67%) of probability. So if you were to buy the ATM straddle, 67% of the time you would lose money or break even. 33% of the time you will turn a profit. If you can figure out how do that with a 1:1 risk/reward ratio, you can see how shorting the expected move has a fairly massive edge (2:1). However the devil is always in the details…
In reality, this is where many edges lie in many option trades, the expected move. Do we think the stock is going to move more or less than the implied volatility is predicting? If you can master this one thing (and have your risk management shit together), you will have a long lucrative career trading options.
Closely related to the expected move is the range (high – low). The range is related to the expected move (volatility) of the stock and they both share the magical property: they are both strongly mean reverting. And we’re not talking about me looking at a chart and saying “Man, that MF’n chart looks like a mean reverter.”
We use math to determine if something is mean reverting and for our purposes, we’re going to use the Hurst Exponent. If you’d like a full explanation of how the Hurst Exponent works and the geeky math behind it, I refer you to Quant Jesus, Dr. Ernie MF’n Chan’s second book:
Essentially how the Hurst Exponent works is we feed it a time series, such as the daily closing prices of a stock or the daily range of a stock. The Hurst Exponent returns a value between 0 and 1.
- values close to 0 indicate the data is very mean reverting
- values around .5 indicate a random walk or in non-quant geek speak: random ass moves
- values closer to 1 indicate strongly trending data
So without further babbling, let’s pump some data through the Hurst Exponent and see how we can use it to make some ca$h money dollah dollar bills. Make it rain… make it hurricane.
The Hurst Exponent In Action
What does this have to do with hacking the expected move? You will soon see.
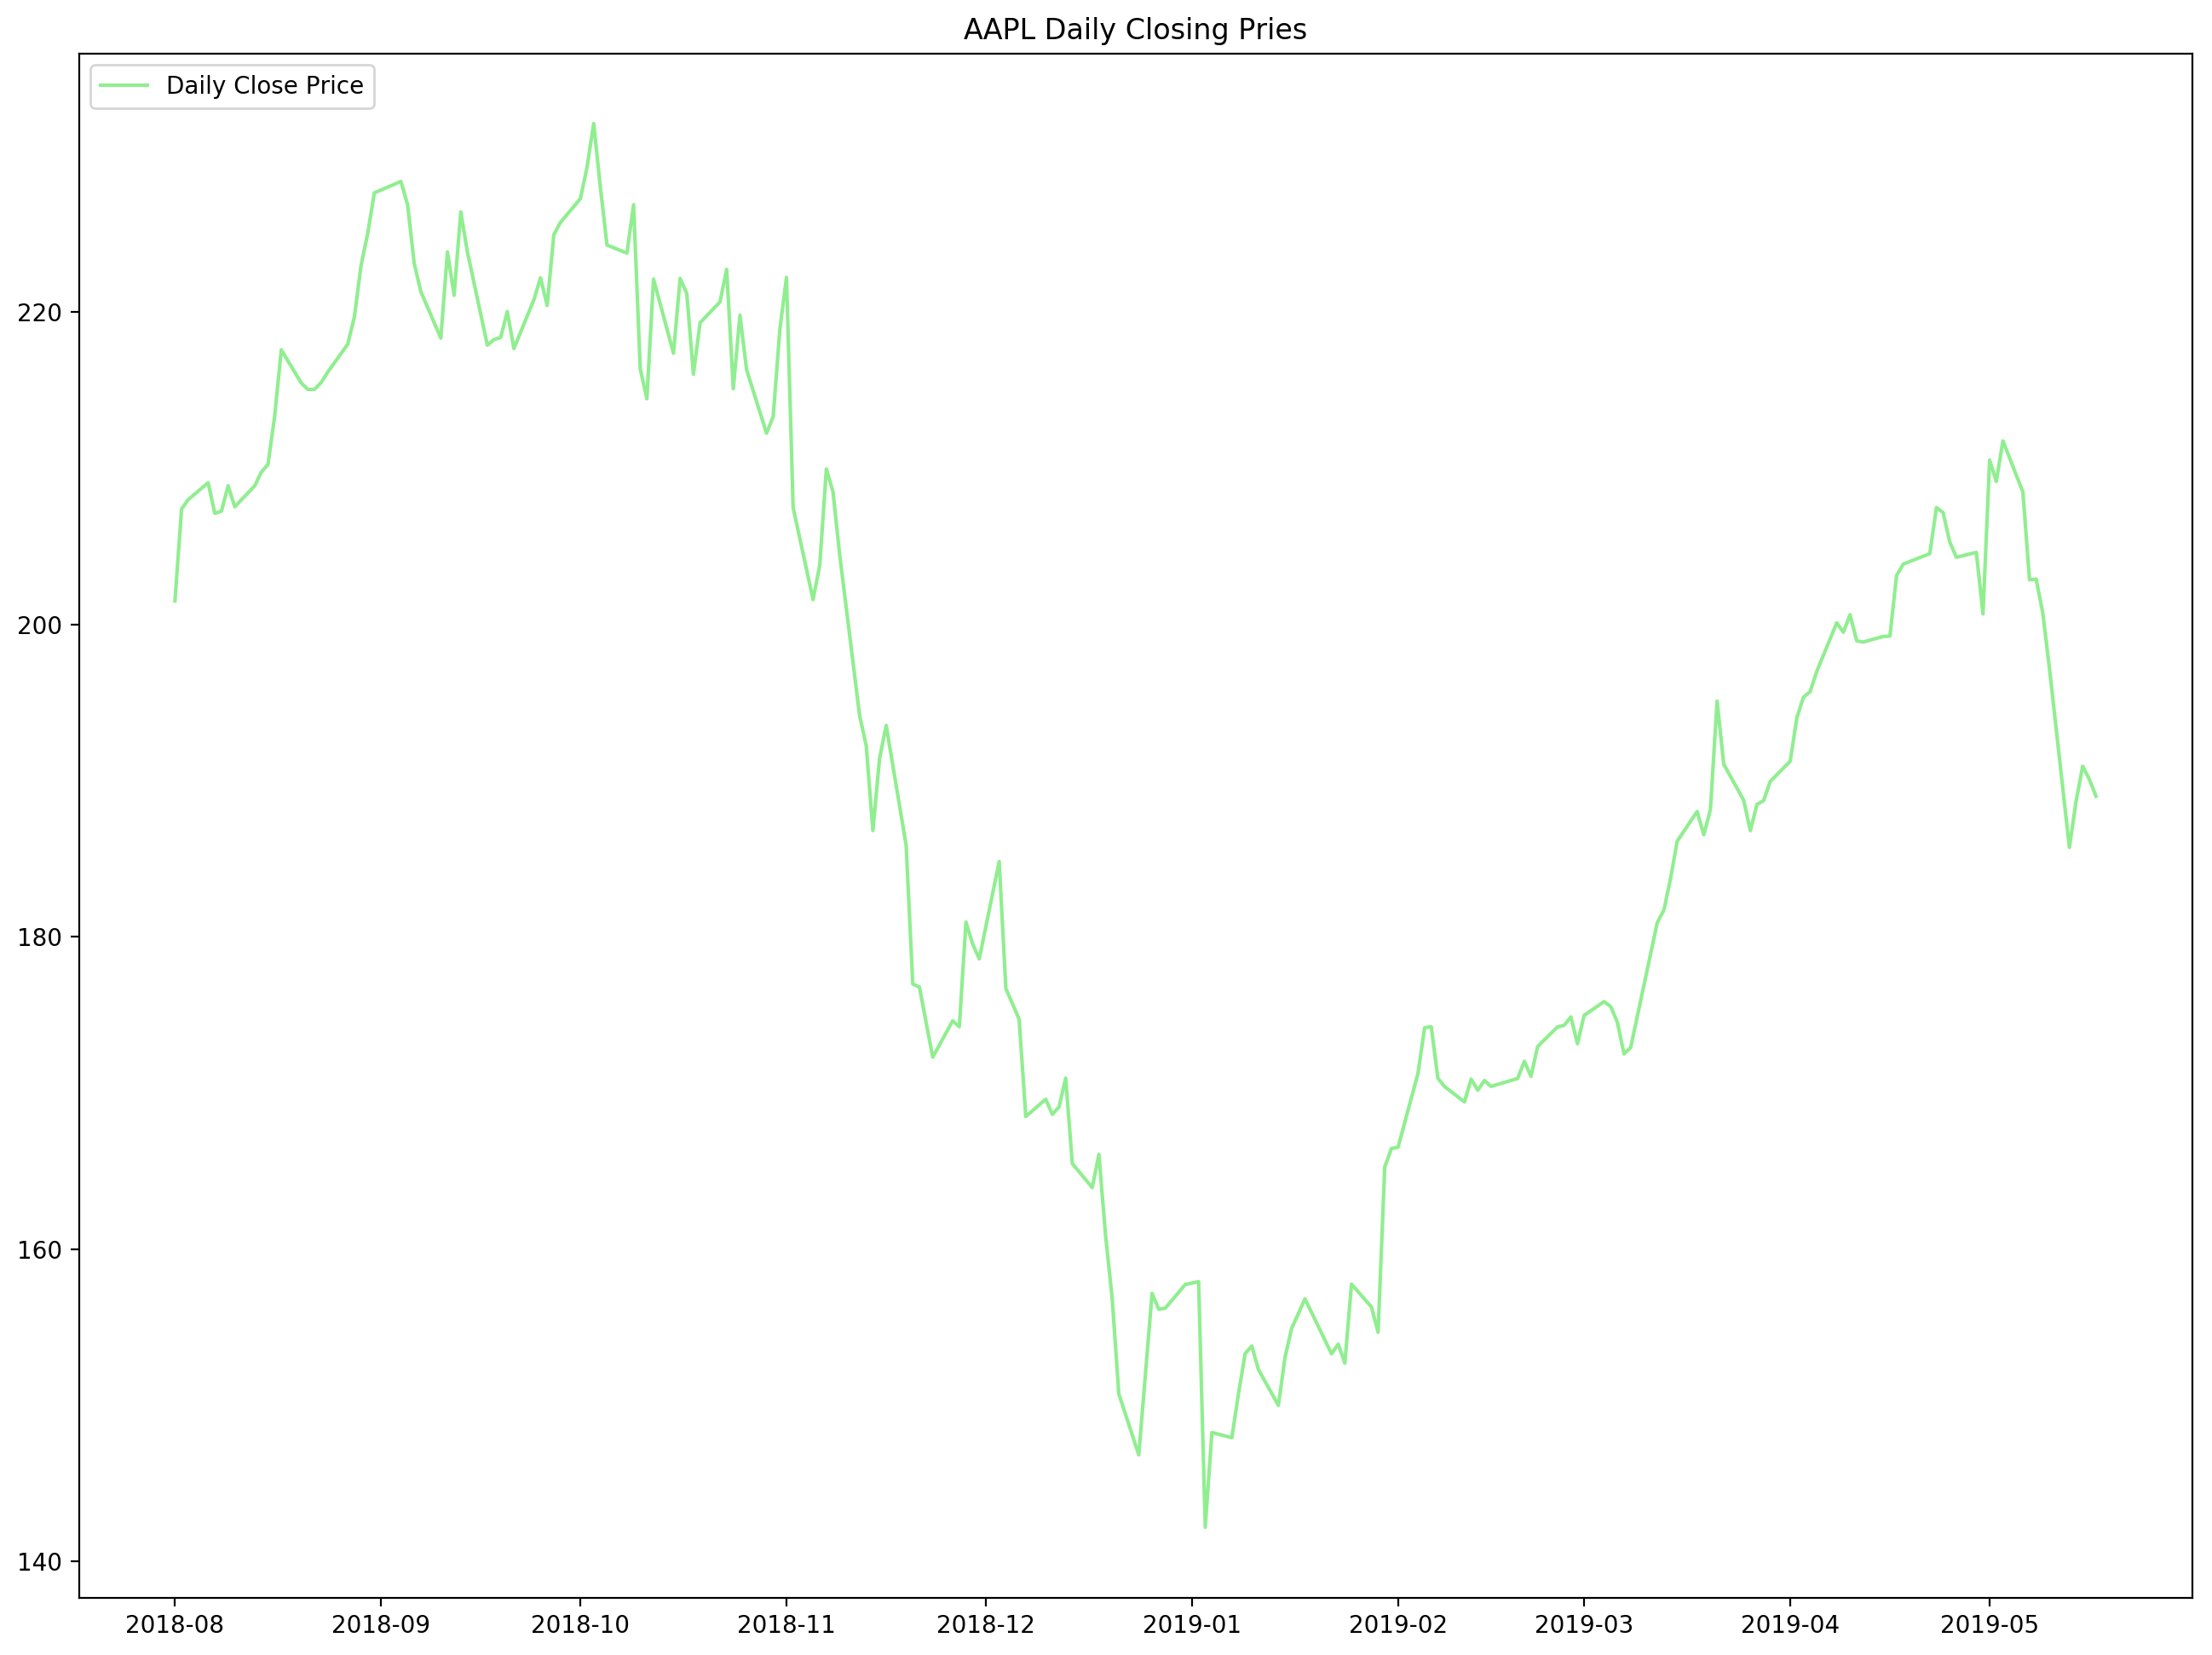
Let’s start by pulling in the daily closing prices of AAPL and plotting some things. First a simple chart of the closing prices of AAPL.
Next with some simple pandas magic in python we can down sample the daily data into weekly data to arrive at the weekly returns. The weekly returns are simply the close-to-close returns or in English, the percent change from last Friday’ price:
(this Fridays closing price – last Fridays closing price) / last Friday’s closing price
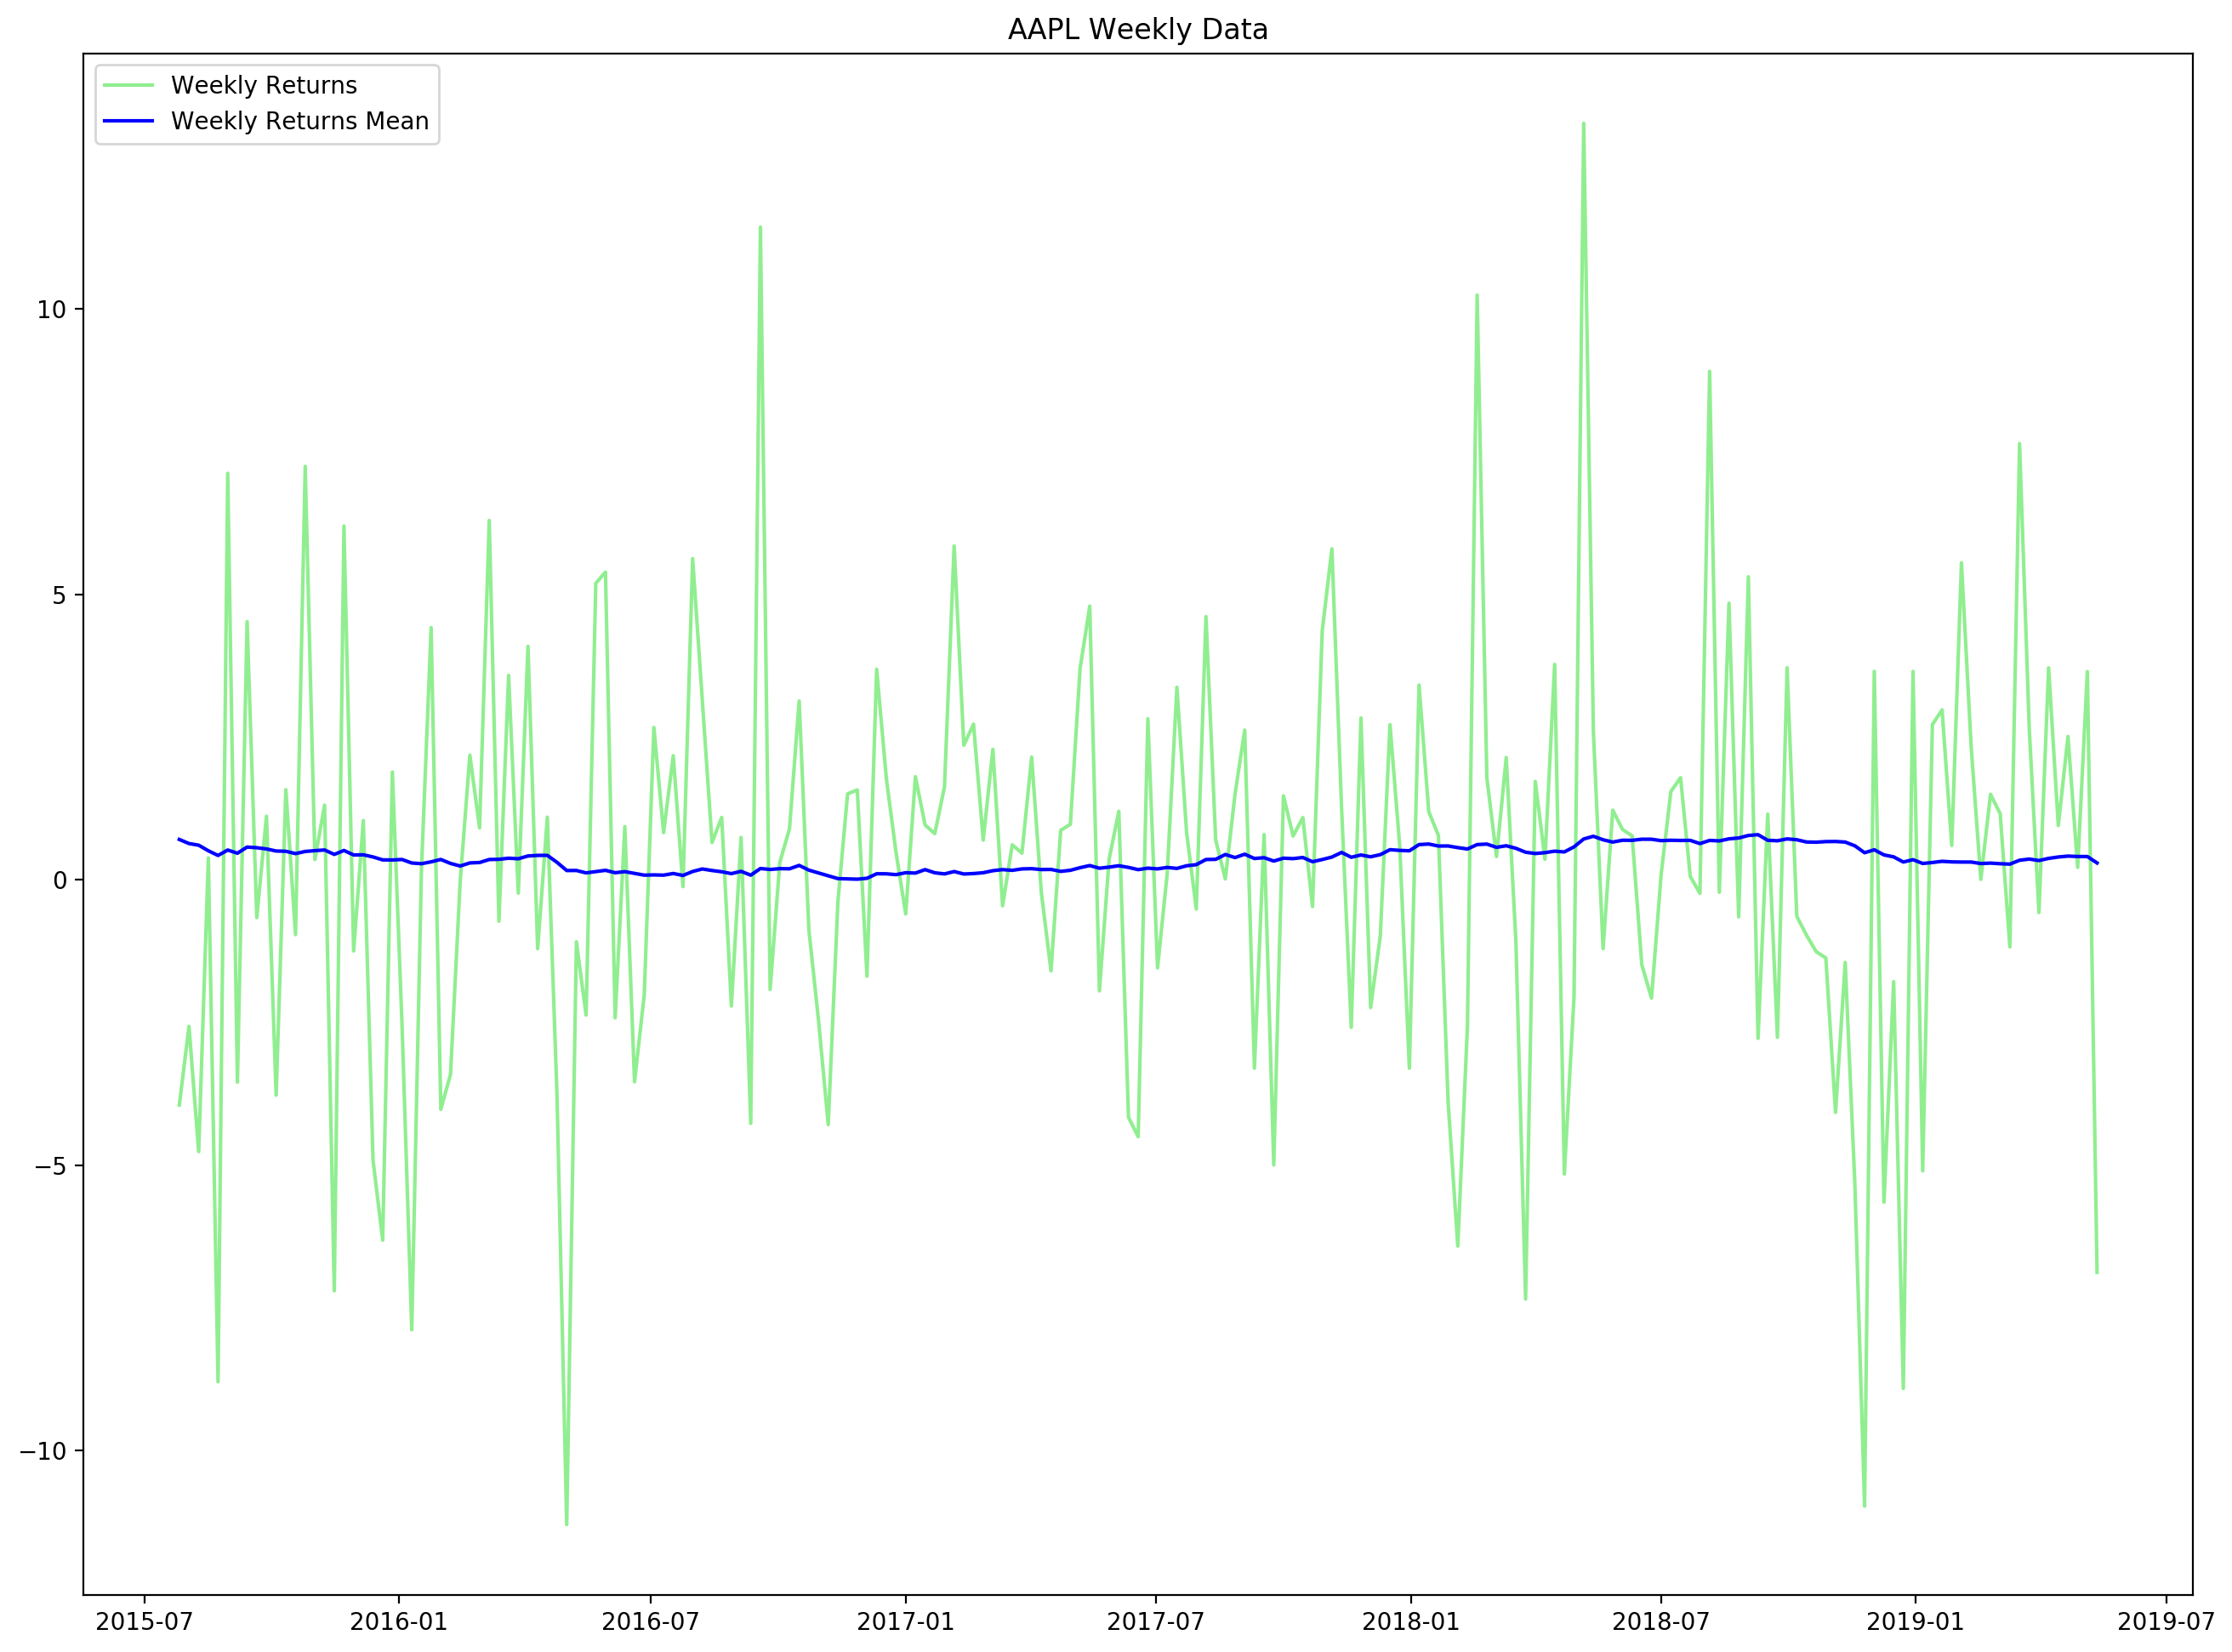
From this chart, you don’t need to be a quant dork to see that the weekly returns are mean reverting.
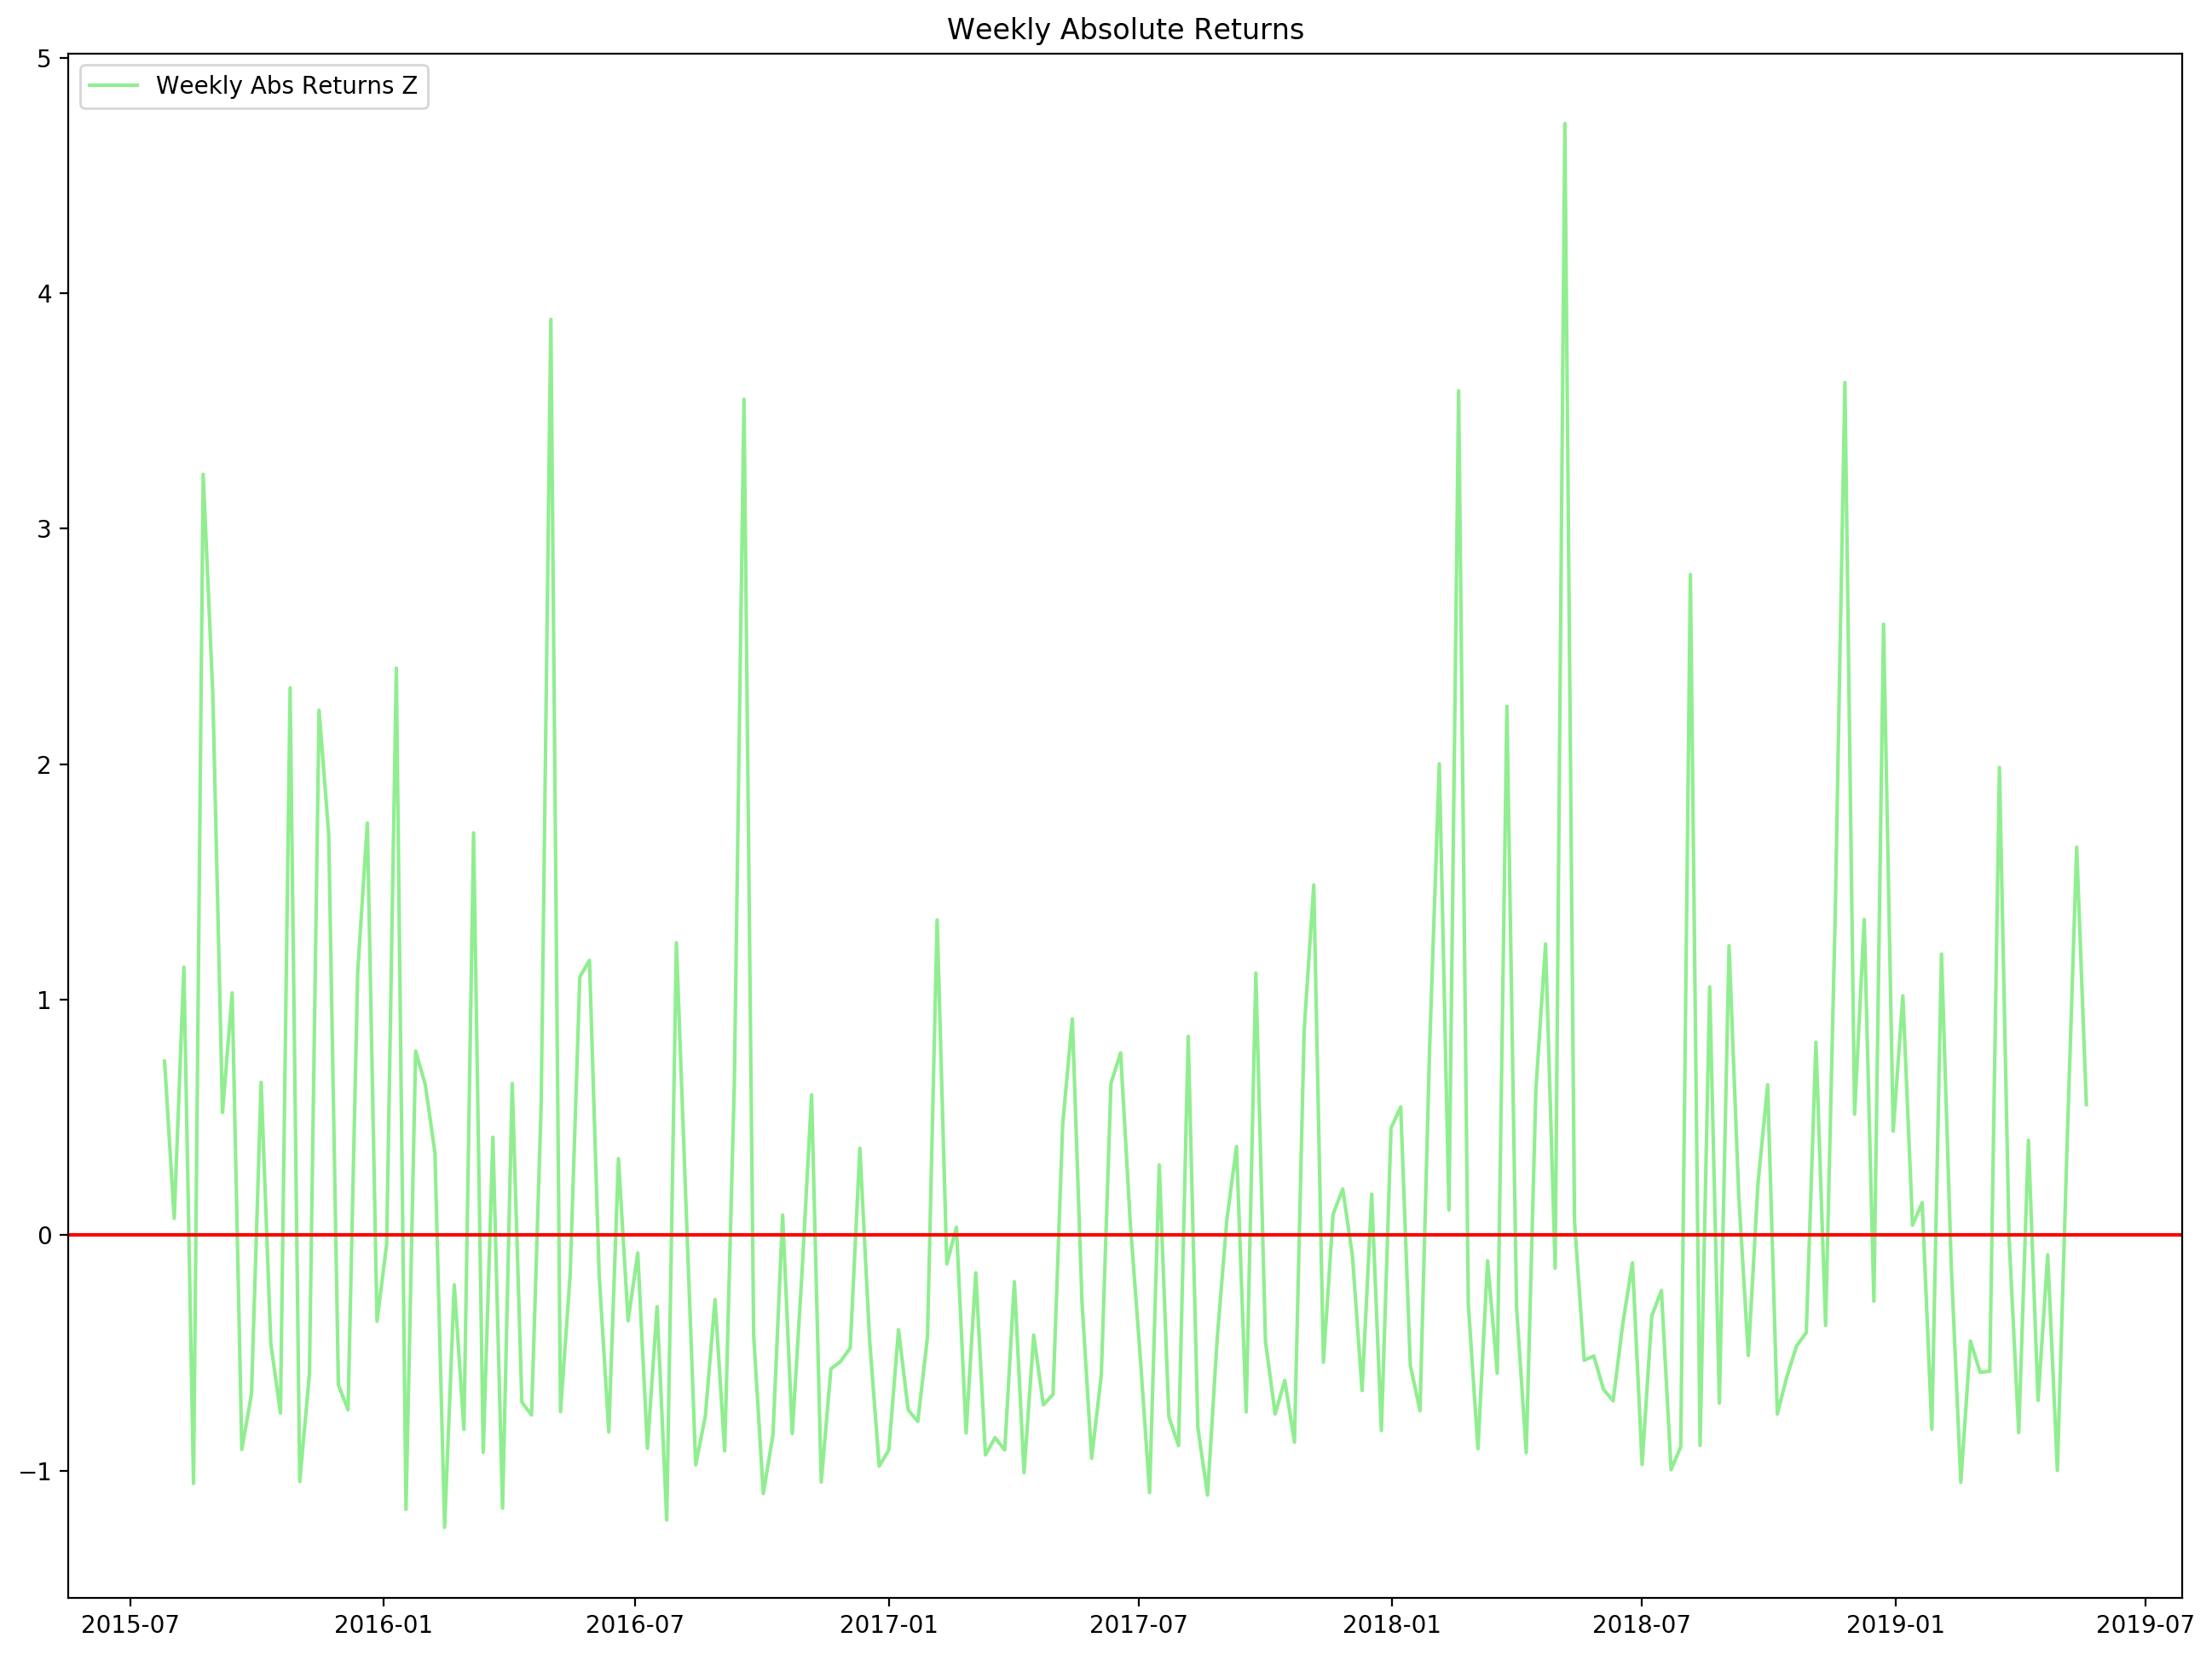
To work in volatility we need the unsigned returns. In English, what this means is we’re going drop the +/- from the percent returns to calculate volatility or just take the absolute value of the returns. I’ve then converted it into a z-score and plotted it, this is what that looks like:
And finally the weekly range, also in a rolling 52 week z-score:

Now let’s pump all of this data through the Hurst exponent magic box:
- Apple daily closing prices: .530
- Apple weekly returns: .008
- Apple weekly absolute returns: .017
- Apple weekly range: .031
We can see that the last three are very mean reverting, based on their values near zero. Not exactly shocking, it’s quite obvious from the charts, but math confirms.
Why am I working in weekly returns in ranges? Most of the options we’re interested in trading on a short term basis need to be liquid. The most liquid stocks tend to have weekly options, hence we’re concerned what the expected move is over the course of a week. We want to turn and earn baby – the more often we can make trades, the more we can potentially earn. Liquid weeklies, and even the 3x weeklies on SPY offer lots of trading potential. Turn and earn baby!
Putting It Together
With mean reverting data such as weekly volatility, there are many methods of predicting mean reversion data. In finance, the most well known is GARCH, which is a method for predicting volatility. It’s used widely throughout the financial industry for measuring risk and market exposure based on volatility.
In fact, the guys that came up with it won a noble price for it. Even if you’re not a math geek, most traders can wrap their heads around the concept of GARCH. And I highly recommend you do that. Once you understand the concept at a deep level, it will immensely help you as both an intraday stock trader and options trader. Probably 90% of the work I do in the quant algo world revolves around this.
However GARCH isn’t limited to working with just volatility, the concept works well on most mean reverting data – we can use it to predict weekly range as well. In the modern era, there are a battery of machine learning methods for predicting mean reversion data that are super simple to implement into trading algos.
Dummying It Down
Even though all of my trading revolves around mathematical relationships, most of my insights come from observation. Without breaking out GARCH or scikit-learn in python to make volatility prediction algos, let’s make some observations of the weekly absolute returns chart again.
Some observations:
- Most of the moves to extremes are usually followed by moves the other way. A weekly move around Z -1.0 is usually followed by a move z > 0.
- Likewise, most of the extreme weekly moves with Z > 1.0 are usually followed by a move with Z < 0, or a quiet week.
- Of the last 400 weeks, there are 153 weeks with Z > 0 or 38.2%
- Of the last 400 weeks, there are 247 weeks with Z < 0 or 61.8%
We can see that these numbers ball park correlate to the expected move being approximatley 67% or 1 standard deviation of probability
So how can we use this? The simple answer: based on mean reversion, if we’ve had a big move, the next weeks move is likely to be quiet, less than the expected move. Hence we put on trades designed to turn a profit when the actual move is less than the expected move. And if last weeks moves was down near Z -1, we can expect a move of Z > 0 the following week.
I can’t hand you the keys to kingdom, but for the astute trader I’ve opened pandoras box and given you enough to put the rest together yourself and start crushing it.


