


Statistics For Week 8-2020
Statistics For Week 8-2020
I had an interesting chat with Tony this weekend and we somehow ended up delving into the topic of education and in particular the importance of how a person is introduced to a particular subject matter, and in particular by whom. My personal view is that it’s somewhat related to the old adage which states that “you’ll never get a second chance to make a first impression”. For example, how many of you had really boring or uninspiring math teachers and accordingly ended up hating it for the remainder of you life?
Now I for one can’t remember my first math teacher, which probably means that he or she was fairly average but at least didn’t scar me for life when it comes to tackling advanced topics like calculus. For the record – I’m no math genius by any definition but I’ve made it a point to keep educating myself on an ongoing basis throughout my adult life.
What really has helped me and many others over the past two decades was the emergence of online learning, which is a popular niche that has been growing steadily over the past two decades. Popular resources are WolframAlpha, Khan Academy, Quantopian, and of course Youtube!
Love it or hate it – Youtube has become my go-to source for brushing up on various math or statistics concepts. And if you’re a student, gone are the times that you are stuck with your university’s sucky math teacher who’s incapable of explaining even the most trivial concept without causing you a major brain freeze. My three most favorite Youtube instructors are:
I’ve actually got mixed feelings about Nancy. She’s extremely sharp and her treatise on derivatives made me wish she had been around back when I was introduced to the topic and had a hard time wrapping my mind around it. And nobody covers trigonometry as gracefully as Nancy. Unfortunately she’s way too hot for her own good and a less mature Mole would have been too distracted by her own geometric parameters… ahem…
Michel Van Biezen made me realize that how little I actually know about pretty much anything. The range of topics Mr. Van Biezen seemingly excels in and is able to teach in a concise manner simply boggles the mind. I recommend in particular his extensive series on the Kalman filter. I hadn’t touched matrix equations since dinosaurs ruled the planet and it was a great opportunity to brush up on all that.
Last but not least we have Mr. Nystrome who’s famous for both his disposition towards wearing silly hats and his humorous delivery. But don’t let that fool you – he’s sharp as a tack and I consider him probably one of the most talented and inspirational math teachers I have ever come across.
He’s pretty much my go-to guy when it comes to basic statistical concepts as nobody explains it as well as he does. His comment sections are full of raving reviews and I suspect he is single-handedly responsible for helping a generation of math students to pass their exams. Unfortunately he’s been pretty quiet over the past few years an I hope he’ll decide to return for more geeky pleasures.
Okay we’re kicking off week #8 with an overview of what to expect from a purely statistical perspective. Once again let me remind you all that the trends shown in these charts merely represent a historical bias and should not be taken as an outright prediction. One would think that this would be clear to anyone who’s ever taken a course in statistics but you’d be surprised…
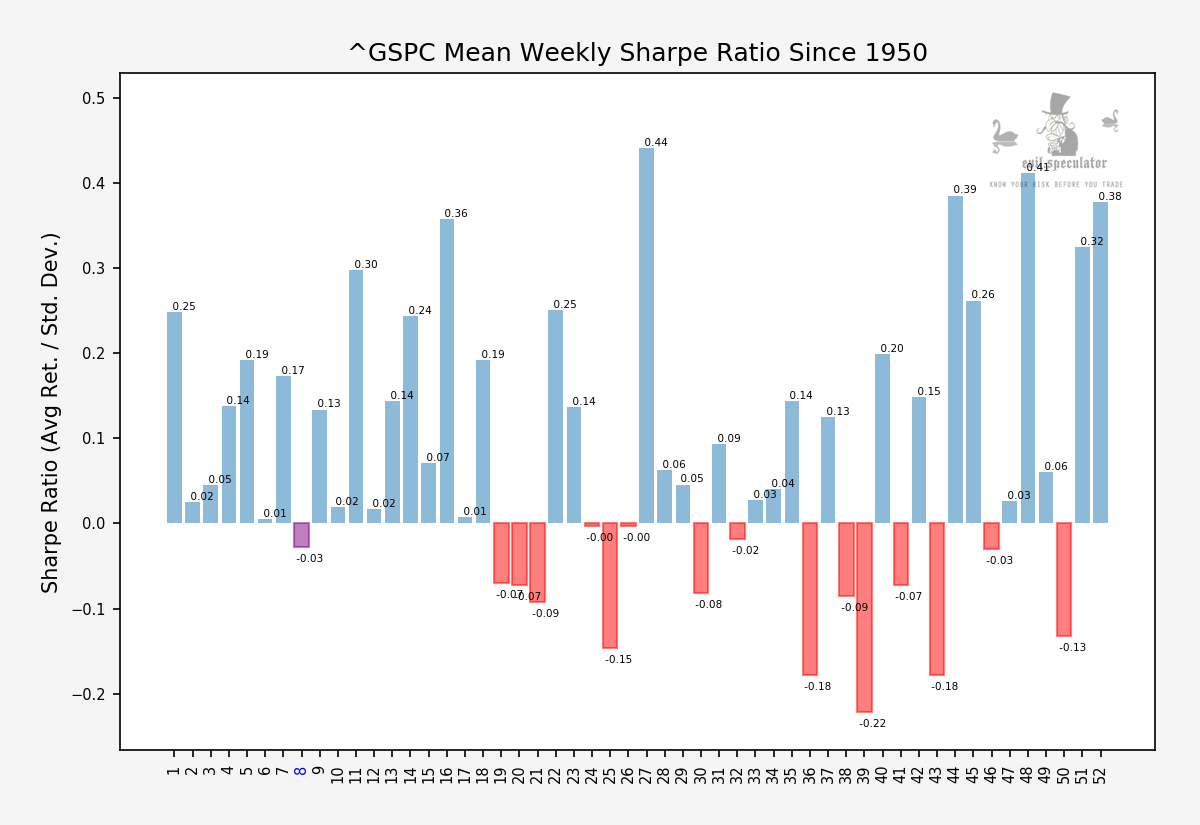
Anyway, we are looking at a very strange week here. Sharpe ratio shows us almost flat but that’s only part of the story.
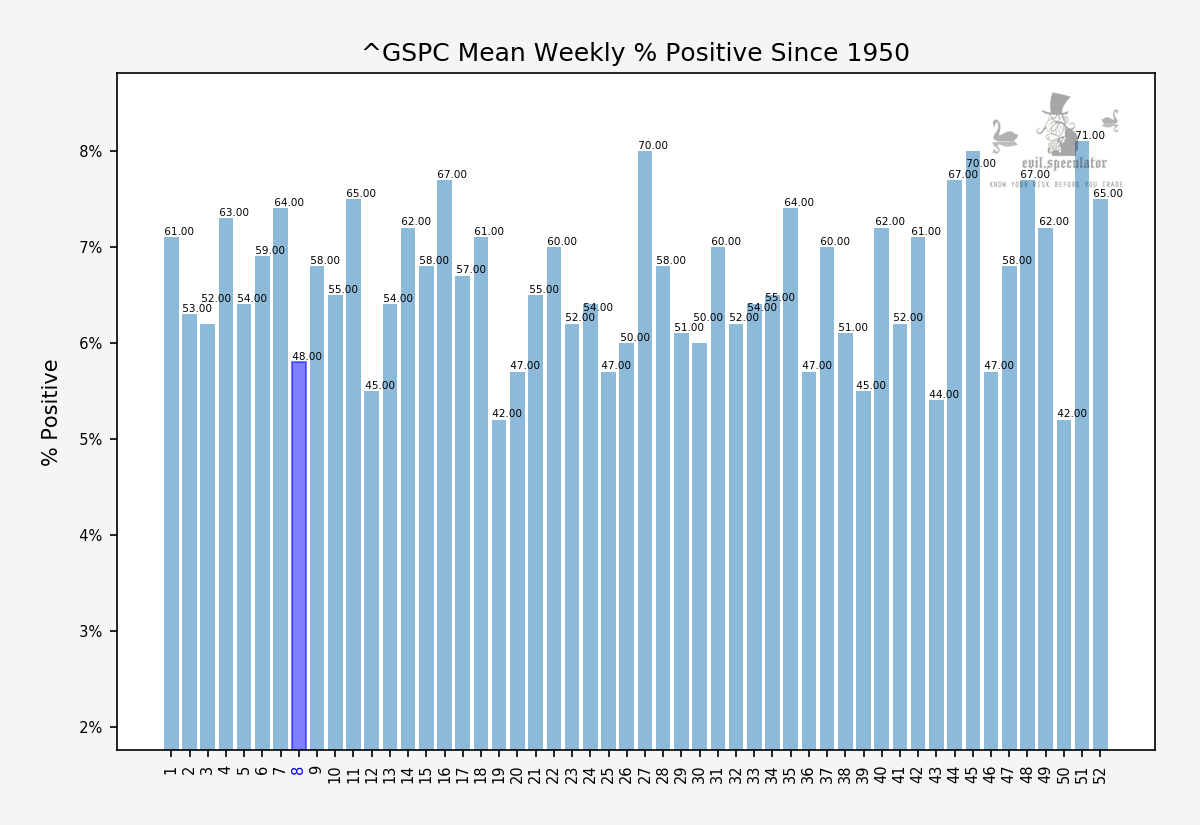
Percent positive is slightly underneath a coin flip, which isn’t encouraging either.
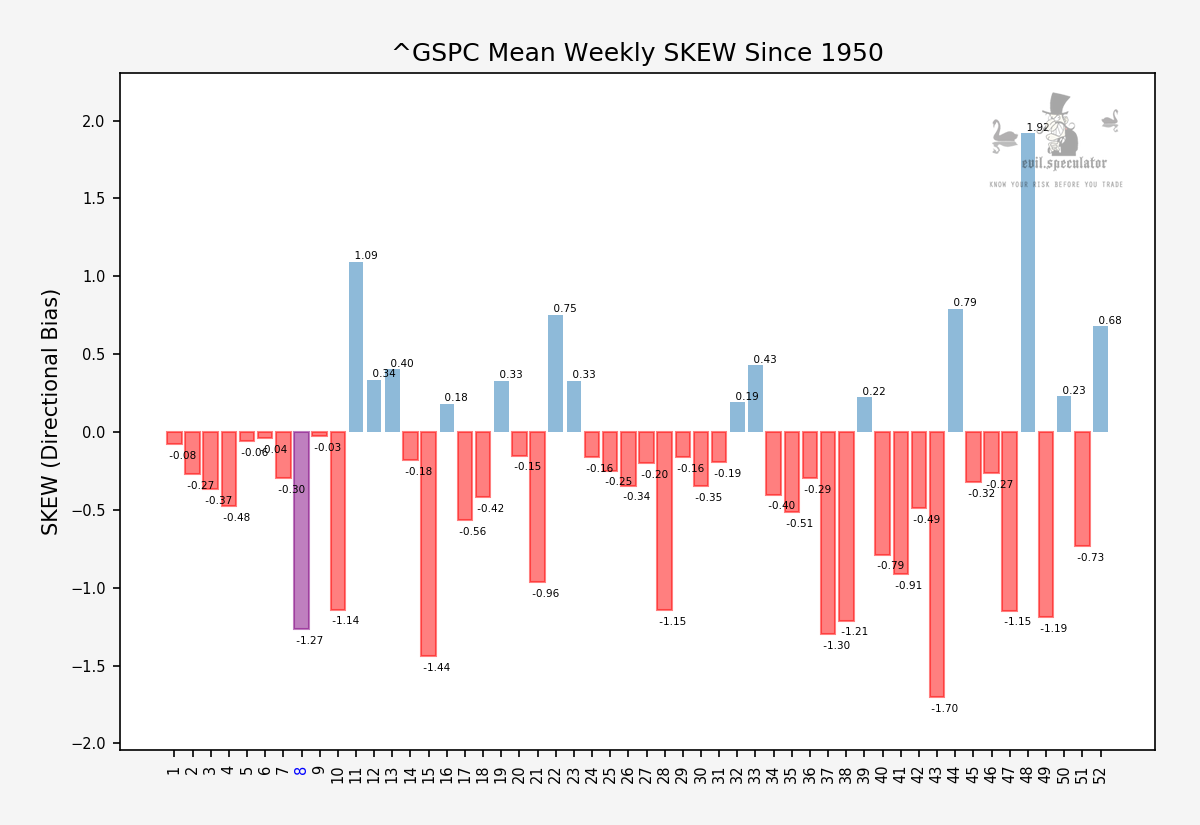
SKEW was rather surprising as it’s pretty deep in the negative (generally a bullish sign). In fact week #8 has the fourth most negative distribution of the entire year. So what’s going on here?
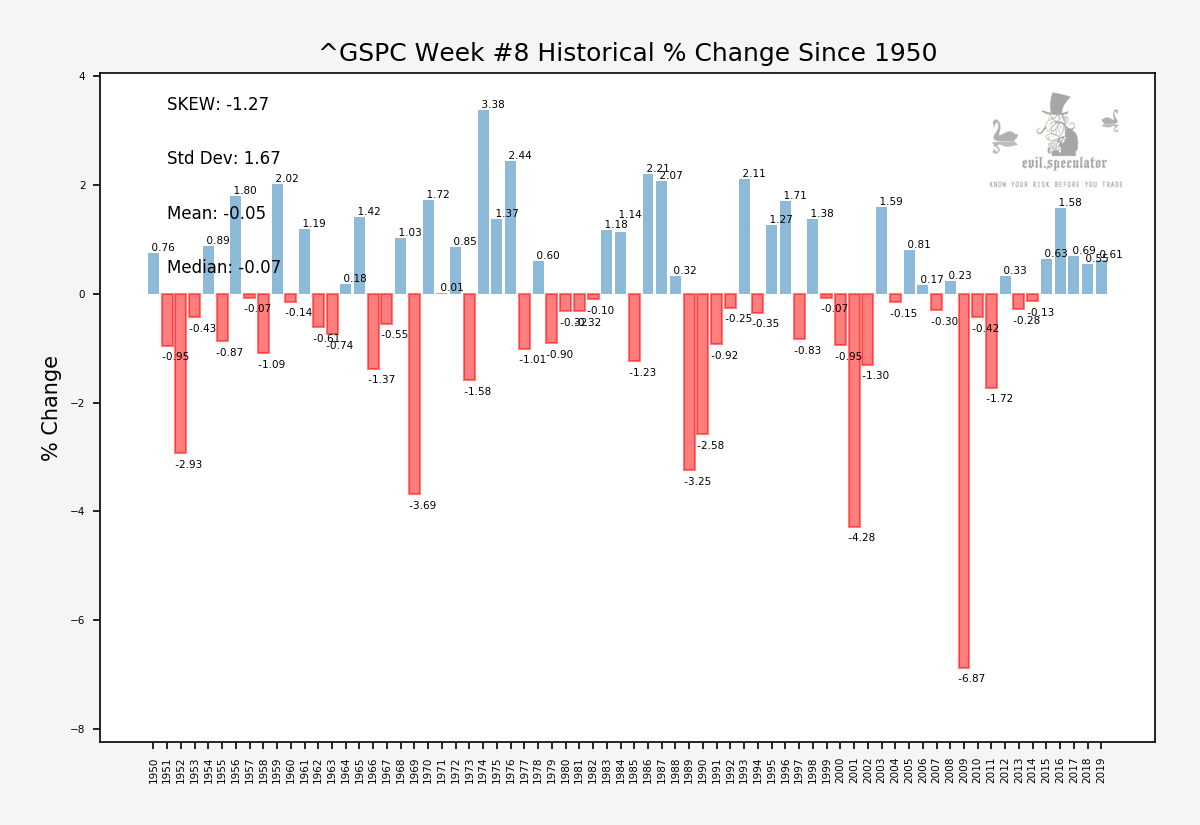
The historical percent change line-up sheds a bit of light on the topic – clearly the positive weeks are thwarted by the negative outliers.
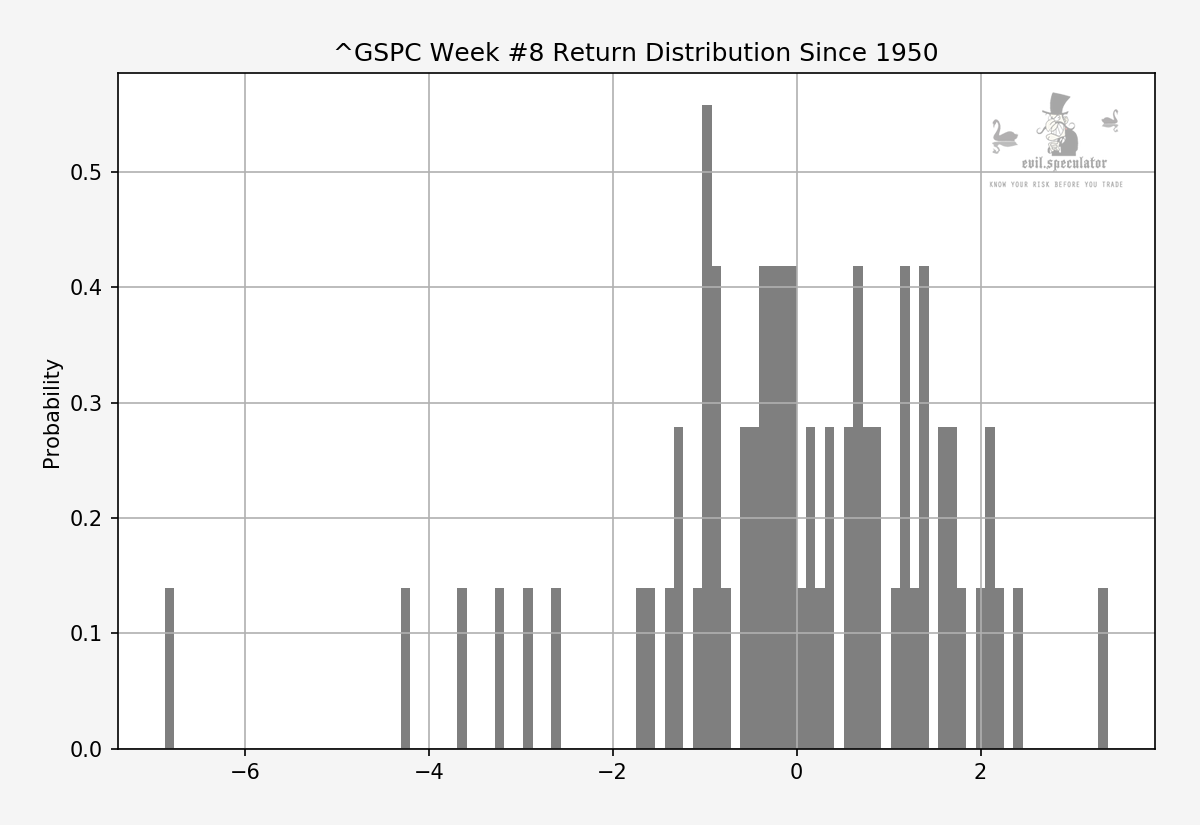
The histogram makes sense of it all. Although there is a pretty normalized distribution curve we have a good number of negative outliers that ruin the party.
Bottom Line
I’d be cautious this week as the potential for a quick wipe out lower is substantial. That doesn’t mean the market cannot push higher but if it starts to drop I would expect a pretty deep retracement. So this may be a good week to lock in your profits with OTM puts or if you have a particular support zone in mind a cheap butterfly.
For my intrepid subs here are the top and bottom performing stock symbols for this week:

It's not too late - learn how to consistently trade without worrying about the news, the clickbait, the daily drama and misinformation. If you are interested in becoming a subscriber then don't waste time and sign up here. The Zero indicator service also offers access to all Gold posts, so you actually get double the bang for your buck.
Please login or subscribe here to see the remainder of this post.


